» US Equity Markets: The equity market posted its 5th best year in the last 20 years as the S&P 500 increased by +26.3% in 2024. The market closed out the year with a bang as the index rose by +11.7% in the 4th quarter and by +4.5% in December. The S&P 500 reached a new all-time high on a total return basis, which includes reinvested dividends. From a price standpoint, the index is only about -0.6% below the all-time closing high of 4,797 reached on January 3rd, 2022. Despite returning +26.3% this year, the S&P experienced two significant drawdowns as the market fell by -8% from 2/2 to 3/13 and -10% from 7/31 to 10/27.
» Treasury Yields: Treasury yields with maturities greater than 12-Months increased for most of the year before peaking in October at multi-year highs. Over the last few months of the year, yields declined as continued evidence of disinflation led the Fed to abandon their “higher-for-longer” outlook and openly discuss cutting interest rates next year. The 2-Year (4.25%) and the 10-Year (3.88%) closed out the year significantly lower than their recent tops.
» US Fixed Income Market: The Bloomberg US Aggregate Bond index (Agg), which acts as a proxy for the intermediate-term investment-grade bond market, increased by +5.5% as the 10-Year Treasury yield (3.88%) ended the year essentially where it started (bond prices move inversely to interest rates and credit spreads). We were pleased to see the bond market end 2023 in the green after two consecutive negative years (2022: -13.0%. 2021: -1.5%).
» Inflation: Most inflation readings have decelerated from peak levels with several indicators returning to normalized ranges. Given that, the Fed is likely getting ready to declare victory over inflation by lowering interest rates at some point next year.
» The Fed: The FOMC raised the federal funds rate by 100 basis points (1.00%) total this year before pausing after their July meeting. The top end of the federal funds rate now stands at 5.50%. Since March of 2022, the Fed has increased interest rates by 5.25% total for one of the quickest tightening cycles in United States history. The FOMC’s most recent Summary of Economic Projections (SEP) showed that the median participant expects they will cut rates by 75 basis points to 4.6% in 2024.
» US Economy: To the surprise of many economists and prognosticators, there was not an economic recession in 2023. Real GDP growth for 2023 is estimated at +2.4%, compared with a forecast of +0.3% at the start of the year. The economy and consumer are still being supported by a strong labor market and excess savings built up since the pandemic. The current consensus estimate is +1.3% for Real GDP growth in 2024.
» Short-Term Market Outlook: The macroeconomic backdrop is brighter now than it was at the beginning of 2023. Keep in mind that the stock market is a discounting mechanism that looks 6-12 months into the future, meaning that the present environment is already reflected in current equity prices. For the stock market to maintain its positive momentum, we will need another year of economic, inflation, and earnings data that exceed expectations. Putting it all together, we believe maintaining a cautious near-term outlook is prudent as our view is that the fundamentals of the market do not warrant a return to all-time highs yet. In recent years we have seen the market boom-and-bust several times, including 2017 into 2018, 2019 into 2020, and 2021 into 2022. We expect the recent boom will lead to more muted returns and higher volatility in 2024. The economic forecasts set forth in this material may not develop as predicted and there can be no guarantee that strategies promoted will be successful.
» Long-Term Market Outlook: In our view, investors with a globally diversified portfolio and a long-term horizon should continue to remain optimistic. Markets have historically increased over time despite frequent drawdowns as successful corporations have been able to figure out ways to generate profits through advances in innovation and productivity. To capitalize on the power of compounding, we believe in the benefits of staying Disciplined, Opportunistic, and Diversified, while Mitigating fees, taxes, and expenses. In our opinion, adhering to a structured process and executing on all these components should help keep our clients on track toward pursuing their long-term objectives. Historically, equity markets have recovered from recessions and downturns. Past performance is no guarantee of future returns. There is no guarantee that a diversified portfolio will enhance overall returns or outperform a non-diversified portfolio. Diversification does not protect against market risk.
Please see some of our most recent market commentaries:
The equity market posted its 5th best year in the last 20 years as the S&P 500 increased by +26.3% in 2023. The market closed out the year with a bang as the index rose by +11.7% in the 4th quarter and by +4.5% in December. The S&P 500 reached a new all-time high on a total return basis, which includes reinvested dividends. From a price standpoint, the index is only about -0.6% below the all-time closing high of 4,797 reached on January 3rd, 2022. Despite returning +26.3% this year, the S&P experienced two significant drawdowns as the market fell by -8% from 2/2 to 3/13 and -10% from 7/31 to 10/27
We constantly remind our clients to maintain a long-term viewpoint as markets can be incredibly volatile over the short term. The stock market has historically gone up over time despite frequent declines. Since 1928, the S&P 500 has generated a total annualized return of +9.6% despite an average peak-to-trough decline of -15% at some point each year. Market performance over the last several years reinforces our belief in a long-term viewpoint. After a dismal 2022, very few market forecasters predicted a strong year in 2023. We suggest not overreacting to a short-term prediction made by a so-called expert. As noted in our S&P 500 Bear Markets chart, historically challenging environments have created strong buying opportunities for long-term investors. Historically, equity markets have recovered from recessions and downturns. Past performance is no guarantee of future returns. Consider your own risk tolerance, financial circumstances, and time horizon.
Our view entering the year was that inflation was the key to the markets in the near term. That turned out to be true. Other factors driving the market returns were the economy, labor market, and corporate earnings holding up better than expected, the Fed thinking about cutting rates next year, and the perceived benefit that artificial intelligence (AI) will have on profits and productivity.
Source: Bloomberg
Size / Style / Sector
» Size: Large Caps (S&P 500: +26.3%) outperformed Mid (S&P 400: +16.4%) and Small (Russell 2000: +16.9%). » Style: Growth (Russell 1000 Growth: +42.7%) exceeded Value (Russell 1000 Value: +11.4%). » Sector: This year saw a substantial reversal at the sector level with last year’s laggards becoming the leaders and vice versa. The three worst performing sectors of 2022 led the way in 2023 as Technology (+57.8%), Communication Services (+55.8%), Consumer Discretionary (+42.3%) were elevated by the Magnificent 7 stocks. Meanwhile, the best performing sectors last year, Energy (-1.4%) and Utilities (-7.1%), were the only two to finish 2023 in the red. The market often undergoes these violent rotations that can make an under-diversified investor feel like a genius one day and a fool the next. Rather than make risky concentrated bets, we prefer to construct diversified portfolios across regions, countries, market caps, factors, styles, sectors, and industries and tilt toward the areas we feel provide the most potential benefit. There is no guarantee that a diversified portfolio will enhance overall returns or outperform a non-diversified portfolio. Diversification does not protect against market risk. » Magnificent 7: The top seven companies in the S&P 500, which are mainly considered growth stocks and the beneficiaries of the growth in artificial intelligence, received outsize attention this year due to their strong performance: Apple: (+49.0%), Microsoft (+58.2%), Alphabet (+58.3%), Amazon (+80.9%), Nvidia (+239.0%), Tesla (+101.7%), and Meta (+194.1%). Collectively, the Magnificent 7 stocks were responsible for about 60% of the S&P 500’s performance this year. For most the year it seemed like the Magnificent 7 were the only stocks working, although we will highlight that the market broadened out in the 4th quarter as over 55% of S&P 500 companies returned over +10%.
US Fixed Income Markets
Interest Rates
Treasury yields with maturities greater than 12-Months increased for most of the year before peaking in October at multi-year highs. The 2-Year reached 5.26%, the highest level since 2006. The 10-Year hit 5.02%, which was the first move above 5% since July 2007. Over the last few months of the year, yields declined as continued evidence of disinflation led the Fed to abandon their “higher-for-longer” outlook and openly discuss cutting interest rates in 2024. The 2-Year (4.25%) and the 10-Year (3.88%) closed out the year significantly lower than their recent tops. The decline in yields created a boost for the fixed income markets as bond prices move inversely to interest rates and credit spreads.
Short-Term Bonds
Short-term bonds have closer maturities and are consequently less interest rate sensitive than intermediate- or long-term fixed income securities. Pursuing stability and income from short-term bonds, including Treasuries, has been a successful strategy as yields remain elevated. Short-term Treasury yields, including, the 3-Month (5.3%), 6-Month (5.2%), and 12-Month (4.8%) are still at their highest levels since the early 2000s. Once the Fed starts cutting the federal funds rate, short-term Treasury yields should also decline. We don’t expect +5% short-term yields to be around forever, but we are opportunistically enjoying them while they last. If interested, please speak with your advisor about our Cash Alternatives Strategy, which is an investment strategy designed for individuals or entities to invest excess cash seeking potentially attractive yields in a conservative portfolio of short-term fixed income securities, including US Treasuries. Also, please see our recent commentary, Changing Treasury Yields – 4% is the new 5%.Bonds are subject to market and interest rate risk if sold prior to maturity. Bond values will decline as interest rates rise and bonds are subject to availability and change in price. Investing involves risk including loss of principal. This strategy and its related holdings are not FDIC-insured.
Intermediate-Term Bonds
The Bloomberg US Aggregate Bond index (Agg), which acts as a proxy for the intermediate-term investment-grade bond market, increased by +5.5% as the 10-Year Treasury yield (3.88%) ended the year essentially where it started (bond prices move inversely to interest rates and credit spreads). We were pleased to see the bond market end 2023 in the green after two consecutive negative years (2022: -13.0%. 2021: -1.5%).
We hold intermediate-term fixed income in diversified portfolios to pursue ballast and income. The last two-plus years have been frustrating for intermediate-term fixed income investors as bonds have provided negative returns without much ballast. We continue to recommend a patient approach, as all else equal, we expect intermediate-term bonds to provide both ballast and positive returns in the future if yields either stabilize or decline. The strong return since October is a great example of what happens when yields fall. Since October 19th, the 10-Year is down by 111 basis points while the Agg increased by +9.3%.
Intermediate-term bonds are still an attractive investment opportunity in our opinion as the yield to maturity on the US Aggregate Bond index ended the year at 4.5%. Yield to maturity is defined as the estimated annualized rate of return an investor can expect on a bond if purchased today and held to maturity, assuming the issuer makes all their interest and principal payments (i.e., no defaults). In our view, patient investors should be optimistic about intermediate-term fixed income returns over the next several years. Bonds are subject to market and interest rate risk if sold prior to maturity. Bond values will decline as interest rates rise and bonds are subject to availability and change in price.
Source: Bloomberg
Please see our Client Question: Bond Primer where we detail bond mechanics, characteristics, types, risks, and historical returns.
Inflation
The increase in inflation since early-2021 was driven by supply chain bottlenecks, surging energy prices, strong consumer demand caused by a solid labor market, and massive amounts of stimulus. Most inflation readings have decelerated from peak levels with several indicators returning to normalized ranges. Given that, the Fed is likely getting ready to declare victory over inflation by lowering interest rates at some point next year.
The Fed has divided inflation into three buckets: goods (prices are now essentially flat as supply chains have normalized), housing (decelerating under rising mortgage rates and just starting to show up in the data), and non-housing related core services (moderating, but still elevated due to the strong labor market and robust wage growth).
The Fed’s latest Summary of Economic Projections show the median participant expects Core PCE Inflation to fall to 2.4% in 2024, 2.2% in 2025, and 2.0% in 2026. Note that the Fed does not have inflation reaching their 2.0% target until 2026.
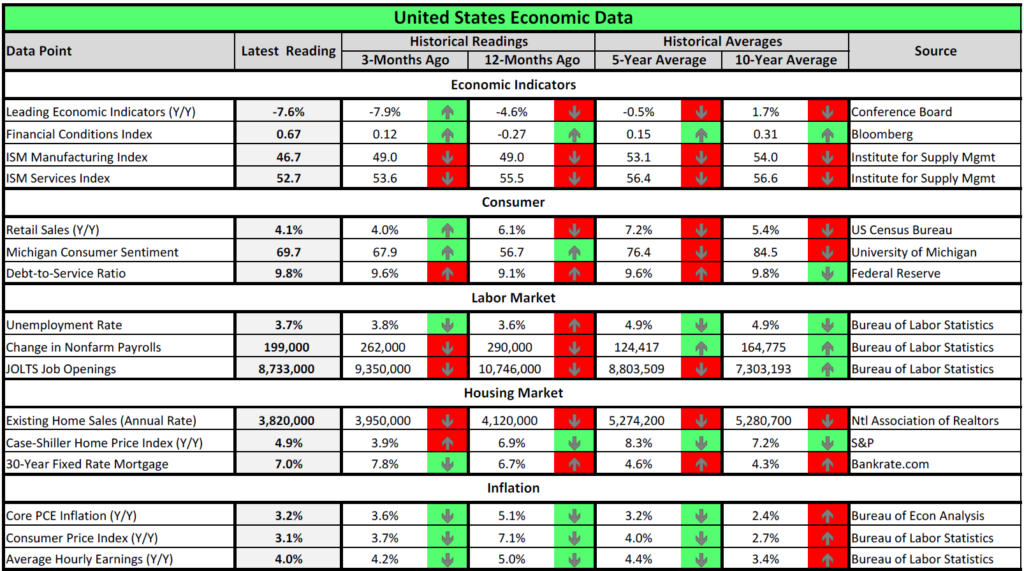
Here are several key inflation indicators and a chart tracking the data since the start of 2020: » The Bureau of Labor Statistics Consumer Price Index (CPI) is a measure of the average change over time in the prices paid by urban consumers for a market basket of consumer goods and services. The index includes food and energy prices. o Latest Reading: 3.1% (November). Peak: 9.1% (June 2022).
» The Core Personal Consumption Expenditure (PCE) Index measures the prices paid by consumers for goods and services based on surveys of what businesses are selling. Core means that the index excludes food and energy prices. This is the Fed’s preferred inflation measure, which they target at an average of 2%. o Latest Reading: 3.2% (November). Peak: 5.6% (February 2022).
» The Core Producer Price Index (PPI) measures the average change in the selling prices received by domestic producers for their output. The prices included in the PPI are from the first commercial transaction for many products and some services. o Latest Reading: 2.0% (November). Peak: 9.7% (March 2022).
» The Bureau of Labor Statistics Average Hourly Earnings tracks total hourly renumeration (in cash or in kind) paid to employees in return for work done (or paid leave). Data is from the Current Employment Statistics (CES) survey. o Latest Reading: 4.0% (November). Peak: 8.1% (April 2020).
» The University of Michigan Inflation Expectations data is based on a monthly survey designed to gauge consumer expectations. Participants are asked for their view on annual inflation over the next 5 to 10 years. o Latest Reading: 2.9% (December). Peak: 3.1% (January 2022).
Source: Bloomberg
The Fed
The Federal Reserve serves as the central bank of the United States and performs critical functions designed to promote the health of the economy and stability of the financial system. The three key entities include the Board of Governors, twelve Federal Reserve Banks, and the Federal Open Market Committee (FOMC). The FOMC sets monetary policy in accordance with its mandate from Congress: to promote maximum employment, stable prices, and moderate long-term interest rates. According to the Fed, “monetary policy directly affects interest rates; it indirectly affects stock prices, wealth, and currency exchange rates. Through these channels, monetary policy influences spending, investment, production, employment, and inflation in the United States.” Please see our Client Question on The Fed which details the key entities, and the impact monetary policy has on the economy, interest rates, and stock prices.
Interest Rates: The FOMC raised the federal funds rate by 100 basis points (1.00%) total this year before pausing after their July meeting. The top end of the federal funds rate now stands at 5.50%. Since March of 2022, the Fed has increased interest rates by 5.25% total for one of the quickest tightening cycles in United States history. The FOMC’s most recent Summary of Economic Projections (SEP) showed that the median participant expects they will cut rates by 75 basis points to 4.6% in 2024. According to Bloomberg, market pricing indicates a more aggressive view, with about 150 basis points of cuts next year and the first one occurring in March.
Balance Sheet – Quantitative Tightening: The Fed is also reducing the size of their nearly $8 trillion balance sheet. The runoff plan is for monthly caps of about $60 billion for Treasuries and $35 billion for agency mortgage-backed securities. The monthly reduction of about $95 billion is larger than the $50 billion per month pace that was used during the 2017-2019 runoff plan. At the current runoff rate, it will take about 3 more years for the Fed’s balance sheet to decrease to its pre-pandemic size.
“The question of when will it become appropriate to begin dialing back the amount of policy restraint in place is clearly a topic of discussion out in the world and also a discussion for us.”- Fed Chair Jerome Powell
The Fed is turning the page after nearly two years of restrictive monetary policy to combat inflation. The Fed’s new focus will be on when to start lowering interest rates in response to moderating inflation. We suspect that the Fed will hold off on cutting interest rates until either of the following scenarios occur:
» The Fed declares victory over inflation. The latest measure of the Fed’s preferred reading, Core PCE Inflation, came in at +3.2% in November, which is still above the Fed’s 2.0% target. The reading likely needs to be under 3% to give the Fed enough confidence that inflation is on a sustained downward trajectory to their 2.0% target. In this scenario, the Fed would cut interest rates so that monetary policy isn’t too restrictive.
» Something breaks in the economy, which causes the Fed to believe that GDP will slow, and that unemployment will rise. We’ve seen the Fed quickly respond to economic shocks by cutting interest rates and turning to accommodative monetary policy.
Source: Bloomberg
US Economy
To the surprise of many economists and prognosticators, there was not an economic recession in 2023. Real GDP growth for 2023 is estimated at +2.4%, compared with a forecast of +0.3% at the start of the year. The economy and consumer are still being supported by a strong labor market and excess savings built up since the pandemic. The current consensus estimate is +1.3% for Real GDP growth in 2024.
While we have been pleased with how the economy has performed, there are still reasons for caution. Several recessionary indicators are still flashing yellow or red, including the inverted yield curve, leading economic indicators, and the ISM Manufacturing survey. There is also some evidence that the consumer may be running low on purchasing power. Furthermore, the lagged effect of tighter monetary policy and the resumption of student loan payments will all weigh on near-term economic activity.
We’re taking a wait-and-see approach as the post-pandemic economy has thrown a series of head fakes. At times a recession seemed imminent and at other times we watched as the labor market set new records. Most forecasters who have been consistently calling for a recession have simply moved their predicated start date to 2024. We continue to believe that the key to economic growth going forward is for inflation to become contained so the Fed can stop their tightening cycle before higher interest rates eventually lead to cracks in the labor market and/or the broader economy. Inflation has made significant progress, and the Fed is probably only several months away from lowering rates, but we are not quite out of the woods yet.
Source: Winthrop Wealth, Bloomberg
Source: Bloomberg
Outlook
Short-Term: Throughout the year we’ve changed our short-term outlook several times by moving back-and-forth from balanced to cautious in response to evolving market conditions. Our investment style tends to be contrarian in the short term and optimistic over the long term. Over short periods, we often turn cautious when the market gets greedy and extended, and positive when the market declines and investors begin to panic. Markets do not move in straight lines, so we attempt to take advantage of volatility by zigging when the market is zagging. We will generally trim equities or get more defensive when we view the market as extended and add to equities during selloffs. We believe this approach helps our clients navigate volatile markets through a comprehensive and repeatable process. No strategy assures success or protects against loss.
The macroeconomic backdrop is brighter now than it was at the beginning of 2023. Keep in mind that the stock market is a discounting mechanism that looks 6-12 months into the future, meaning that the present environment is already reflected in current equity prices. For the stock market to maintain its positive momentum, we will need another year of economic, inflation, and earnings data that exceed expectations. Putting it all together, we believe maintaining a cautious near-term outlook is prudent as our view is that the fundamentals of the market do not warrant a return to all-time highs yet. In recent years we have seen the market boom-and-bust several times, including 2017 into 2018, 2019 into 2020, and 2021 into 2022. We expect more muted returns and higher volatility in 2024 as the bill for this year’s rally comes due.
Long-term: In our view, investors with a globally diversified portfolio and a long-term time horizon should continue to remain optimistic. Markets have historically increased over time despite frequent drawdowns as successful corporations have been able to figure out ways to generate profits through advances in innovation and productivity. To capitalize on the power of compounding, we believe in the benefits of staying Disciplined, Opportunistic, and Diversified, while striving to Mitigate fees, taxes, and expenses.
» Disciplined: consistently applying our investment process and philosophy, which are grounded in a long-term approach. » Opportunistic: rebalancing, repositioning, and tax-loss harvesting to take advantage of market volatility and dislocations. » Diversified: seeking to ensure that portfolios are properly allocated across and among asset classes to enhance consistency. » Mitigate: striving to avoid unnecessary disbursements, including fees, taxes, and expenses.
In our opinion, adhering to a structured process and executing on all these components should help keep our clients on track toward pursuing their long-term objectives. Historically, equity markets have recovered from recessions and downturns. Past performance is no guarantee of future returns. There is no guarantee that a diversified portfolio will enhance overall returns or outperform a non-diversified portfolio. Diversification does not protect against market risk.
2023 Market Returns
Source: Bloomberg
DISCLOSURES
Content in this material is for general information only and not intended to provide specific advice or recommendations for any individual.
The economic forecasts set forth in this material may not develop as predicted and there can be no guarantee that strategies promoted will be successful.
All indexes mentioned are unmanaged indexes which cannot be invested into directly. Unmanaged index returns do not reflect fees, expenses, or sales charges. Index performance is not indicative of the performance of any investment. Past performance is no guarantee of future results.
The Standard & Poor’s 500 Index is a capitalization weighted index of 500 stocks designed to measure performance of the broad domestic economy through changes in the aggregate market value of 500 stocks representing all major industries.
The S&P Midcap 400 Stock Index is an unmanaged index generally representative of the market for the stocks of mid-sized US companies.
The Russell 2000 Index is an unmanaged index generally representative of the 2,000 smallest companies in the Russell 3000 index, which represents approximately 10% of the total market capitalization of the Russell 3000 Index.
The Russell 1000 Growth Index measures the performance of those Russell 1000 companies with higher price-to-book ratios and higher forecasted growth values. Russell 1000 Value Index measures the performance of those Russell 1000 companies with lower price-to-book ratios and lower forecasted growth values.
The Russell 3000 Growth Index is an unmanaged index comprised of those Russell 3000 companies with higher price-to-book ratios and higher forecasted growth values. The Russell 3000 Value Index measures the performance of those Russell 3000 companies with lower price-to-book ratios and lower forecasted growth values.
The prices of small cap stocks and mid cap stocks are generally more volatile than large cap stocks. The MSCI EAFE Index is a free float-adjusted market capitalization index that is designed to measure the equity market performance of developed markets, excluding the US & Canada.
The MSCI EAFE Index consists of the following developed country indices: Australia, Austria, Belgium, Denmark, Finland, France, Germany, Hong Kong, Ireland, Israel, Italy, Japan, the Netherlands, New Zealand, Norway, Portugal, Singapore, Spain, Sweden, Switzerland and the UK.
The MSCI EM (Emerging Markets) Index is a free float-adjusted market capitalization weighted index that is designed to measure the equity market performance of the emerging market countries of the Americas, Europe, the Middle East, Africa and Asia. The MSCI EM Index consists of the following emerging market country indices: Brazil, Chile, Colombia, Mexico, Peru, Czech Republic, Egypt, Greece, Hungary, Poland, Qatar, Russia, South Africa. Turkey, United Arab Emirates, China, India, Indonesia, Korea, Malaysia, Philippines, Taiwan, and Thailand.
The MSCI US Broad Market Index captures broad US equity coverage. The index includes 3,204 constituents across large, mid, small and micro capitalizations, representing about 99% of the US equity universe.
International investing involves special risks such as currency fluctuation and political instability and may not be suitable for all investors. These risks are often heightened for investments in emerging markets.
The Barclays Capital US Corporate High Yield Bond index is an index representative of the universe of fixed-rate, non-investment grade debt.
The Bloomberg Barclays U.S. Aggregate Bond Index is an index of the U.S. investment-grade fixed-rate bond market, including both government and corporate bonds.
The Bloomberg Barclays US Treasury Bills 1-3 Month Index is designed to measure the performance of public obligations of the U.S. Treasury that have a remaining maturity of greater than or equal to 1 month and less than 3 months. The Index includes all publicly issued zero coupon U.S. Treasury Bills that have a remaining maturity of less than 3 months and at least 1 month, are rated investment grade, and have $300 million or more of outstanding face value.
Bonds are subject to market and interest rate risk if sold prior to maturity. Bond values will decline as interest rates rise and bonds are subject to availability and change in price.
Government bonds and Treasury bills are guaranteed by the US government as to the timely payment of principal and interest and, if held to maturity, offer a fixed rate of return and fixed principal value.
Municipal bonds are subject to availability and change in price. They are subject to market and interest rate risk if sold prior to maturity. Bond values will decline as interest rates rise. Interest income may be subject to the alternative minimum tax. Municipal bonds are federally tax-free but other state and local taxes may apply. If sold prior to maturity, capital gains tax could apply.
High yield/junk bonds (grade BB or below) are not investment grade securities, and are subject to higher interest rate, credit, and liquidity risks than those graded BBB and above. They generally should be part of a diversified portfolio for sophisticated investors.
The market value of corporate bonds will fluctuate, and if the bond is sold prior to maturity, the investor’s yield may differ from the advertised yield.
Financial planning is a tool intended to review your current financial situation, investment objectives and goals, and suggest potential planning ideas and concepts that may be of benefit. There is no guarantee that financial planning will help you reach your goals.
Asset allocation does not ensure a profit or protect against loss. There is no guarantee that a diversified portfolio will enhance overall returns or outperform a non-diversified portfolio.
Diversification does not protect against market risk. All investing involves risk which you should be prepared to bear.
Securities offered through LPL Financial, Member FINRA/SIPC. Investment Advice offered through Winthrop Wealth, a Registered Investment Advisor and separate entity from LPL Financial.


< COMMENTARY
Market Commentary | January 05, 2024
2023 Market Review and Outlook
By Andrew Murphy, CFA
Co-Chief Investment Officer
Print/Download Written Commentary
2023 Highlights
All data sourced from Bloomberg, 12/29/2023
» US Equity Markets: The equity market posted its 5th best year in the last 20 years as the S&P 500 increased by +26.3% in 2024. The market closed out the year with a bang as the index rose by +11.7% in the 4th quarter and by +4.5% in December. The S&P 500 reached a new all-time high on a total return basis, which includes reinvested dividends. From a price standpoint, the index is only about -0.6% below the all-time closing high of 4,797 reached on January 3rd, 2022. Despite returning +26.3% this year, the S&P experienced two significant drawdowns as the market fell by -8% from 2/2 to 3/13 and -10% from 7/31 to 10/27.
» Treasury Yields: Treasury yields with maturities greater than 12-Months increased for most of the year before peaking in October at multi-year highs. Over the last few months of the year, yields declined as continued evidence of disinflation led the Fed to abandon their “higher-for-longer” outlook and openly discuss cutting interest rates next year. The 2-Year (4.25%) and the 10-Year (3.88%) closed out the year significantly lower than their recent tops.
» US Fixed Income Market: The Bloomberg US Aggregate Bond index (Agg), which acts as a proxy for the intermediate-term investment-grade bond market, increased by +5.5% as the 10-Year Treasury yield (3.88%) ended the year essentially where it started (bond prices move inversely to interest rates and credit spreads). We were pleased to see the bond market end 2023 in the green after two consecutive negative years (2022: -13.0%. 2021: -1.5%).
» Inflation: Most inflation readings have decelerated from peak levels with several indicators returning to normalized ranges. Given that, the Fed is likely getting ready to declare victory over inflation by lowering interest rates at some point next year.
» The Fed: The FOMC raised the federal funds rate by 100 basis points (1.00%) total this year before pausing after their July meeting. The top end of the federal funds rate now stands at 5.50%. Since March of 2022, the Fed has increased interest rates by 5.25% total for one of the quickest tightening cycles in United States history. The FOMC’s most recent Summary of Economic Projections (SEP) showed that the median participant expects they will cut rates by 75 basis points to 4.6% in 2024.
» US Economy: To the surprise of many economists and prognosticators, there was not an economic recession in 2023. Real GDP growth for 2023 is estimated at +2.4%, compared with a forecast of +0.3% at the start of the year. The economy and consumer are still being supported by a strong labor market and excess savings built up since the pandemic. The current consensus estimate is +1.3% for Real GDP growth in 2024.
» Short-Term Market Outlook: The macroeconomic backdrop is brighter now than it was at the beginning of 2023. Keep in mind that the stock market is a discounting mechanism that looks 6-12 months into the future, meaning that the present environment is already reflected in current equity prices. For the stock market to maintain its positive momentum, we will need another year of economic, inflation, and earnings data that exceed expectations. Putting it all together, we believe maintaining a cautious near-term outlook is prudent as our view is that the fundamentals of the market do not warrant a return to all-time highs yet. In recent years we have seen the market boom-and-bust several times, including 2017 into 2018, 2019 into 2020, and 2021 into 2022. We expect the recent boom will lead to more muted returns and higher volatility in 2024. The economic forecasts set forth in this material may not develop as predicted and there can be no guarantee that strategies promoted will be successful.
» Long-Term Market Outlook: In our view, investors with a globally diversified portfolio and a long-term horizon should continue to remain optimistic. Markets have historically increased over time despite frequent drawdowns as successful corporations have been able to figure out ways to generate profits through advances in innovation and productivity. To capitalize on the power of compounding, we believe in the benefits of staying Disciplined, Opportunistic, and Diversified, while Mitigating fees, taxes, and expenses. In our opinion, adhering to a structured process and executing on all these components should help keep our clients on track toward pursuing their long-term objectives. Historically, equity markets have recovered from recessions and downturns. Past performance is no guarantee of future returns. There is no guarantee that a diversified portfolio will enhance overall returns or outperform a non-diversified portfolio. Diversification does not protect against market risk.
Please see some of our most recent market commentaries:
US Equity Markets
The equity market posted its 5th best year in the last 20 years as the S&P 500 increased by +26.3% in 2023. The market closed out the year with a bang as the index rose by +11.7% in the 4th quarter and by +4.5% in December. The S&P 500 reached a new all-time high on a total return basis, which includes reinvested dividends. From a price standpoint, the index is only about -0.6% below the all-time closing high of 4,797 reached on January 3rd, 2022. Despite returning +26.3% this year, the S&P experienced two significant drawdowns as the market fell by -8% from 2/2 to 3/13 and -10% from 7/31 to 10/27
We constantly remind our clients to maintain a long-term viewpoint as markets can be incredibly volatile over the short term. The stock market has historically gone up over time despite frequent declines. Since 1928, the S&P 500 has generated a total annualized return of +9.6% despite an average peak-to-trough decline of -15% at some point each year. Market performance over the last several years reinforces our belief in a long-term viewpoint. After a dismal 2022, very few market forecasters predicted a strong year in 2023. We suggest not overreacting to a short-term prediction made by a so-called expert. As noted in our S&P 500 Bear Markets chart, historically challenging environments have created strong buying opportunities for long-term investors. Historically, equity markets have recovered from recessions and downturns. Past performance is no guarantee of future returns. Consider your own risk tolerance, financial circumstances, and time horizon.
Our view entering the year was that inflation was the key to the markets in the near term. That turned out to be true. Other factors driving the market returns were the economy, labor market, and corporate earnings holding up better than expected, the Fed thinking about cutting rates next year, and the perceived benefit that artificial intelligence (AI) will have on profits and productivity.
Size / Style / Sector
» Size: Large Caps (S&P 500: +26.3%) outperformed Mid (S&P 400: +16.4%) and Small (Russell 2000: +16.9%).
» Style: Growth (Russell 1000 Growth: +42.7%) exceeded Value (Russell 1000 Value: +11.4%).
» Sector: This year saw a substantial reversal at the sector level with last year’s laggards becoming the leaders and vice versa. The three worst performing sectors of 2022 led the way in 2023 as Technology (+57.8%), Communication Services (+55.8%), Consumer Discretionary (+42.3%) were elevated by the Magnificent 7 stocks. Meanwhile, the best performing sectors last year, Energy (-1.4%) and Utilities (-7.1%), were the only two to finish 2023 in the red. The market often undergoes these violent rotations that can make an under-diversified investor feel like a genius one day and a fool the next. Rather than make risky concentrated bets, we prefer to construct diversified portfolios across regions, countries, market caps, factors, styles, sectors, and industries and tilt toward the areas we feel provide the most potential benefit. There is no guarantee that a diversified portfolio will enhance overall returns or outperform a non-diversified portfolio. Diversification does not protect against market risk.
» Magnificent 7: The top seven companies in the S&P 500, which are mainly considered growth stocks and the beneficiaries of the growth in artificial intelligence, received outsize attention this year due to their strong performance: Apple: (+49.0%), Microsoft (+58.2%), Alphabet (+58.3%), Amazon (+80.9%), Nvidia (+239.0%), Tesla (+101.7%), and Meta (+194.1%). Collectively, the Magnificent 7 stocks were responsible for about 60% of the S&P 500’s performance this year. For most the year it seemed like the Magnificent 7 were the only stocks working, although we will highlight that the market broadened out in the 4th quarter as over 55% of S&P 500 companies returned over +10%.
US Fixed Income Markets
Interest Rates
Treasury yields with maturities greater than 12-Months increased for most of the year before peaking in October at multi-year highs. The 2-Year reached 5.26%, the highest level since 2006. The 10-Year hit 5.02%, which was the first move above 5% since July 2007. Over the last few months of the year, yields declined as continued evidence of disinflation led the Fed to abandon their “higher-for-longer” outlook and openly discuss cutting interest rates in 2024. The 2-Year (4.25%) and the 10-Year (3.88%) closed out the year significantly lower than their recent tops. The decline in yields created a boost for the fixed income markets as bond prices move inversely to interest rates and credit spreads.
Short-Term Bonds
Short-term bonds have closer maturities and are consequently less interest rate sensitive than intermediate- or long-term fixed income securities. Pursuing stability and income from short-term bonds, including Treasuries, has been a successful strategy as yields remain elevated. Short-term Treasury yields, including, the 3-Month (5.3%), 6-Month (5.2%), and 12-Month (4.8%) are still at their highest levels since the early 2000s. Once the Fed starts cutting the federal funds rate, short-term Treasury yields should also decline. We don’t expect +5% short-term yields to be around forever, but we are opportunistically enjoying them while they last. If interested, please speak with your advisor about our Cash Alternatives Strategy, which is an investment strategy designed for individuals or entities to invest excess cash seeking potentially attractive yields in a conservative portfolio of short-term fixed income securities, including US Treasuries. Also, please see our recent commentary, Changing Treasury Yields – 4% is the new 5%. Bonds are subject to market and interest rate risk if sold prior to maturity. Bond values will decline as interest rates rise and bonds are subject to availability and change in price. Investing involves risk including loss of principal. This strategy and its related holdings are not FDIC-insured.
Intermediate-Term Bonds
The Bloomberg US Aggregate Bond index (Agg), which acts as a proxy for the intermediate-term investment-grade bond market, increased by +5.5% as the 10-Year Treasury yield (3.88%) ended the year essentially where it started (bond prices move inversely to interest rates and credit spreads). We were pleased to see the bond market end 2023 in the green after two consecutive negative years (2022: -13.0%. 2021: -1.5%).
We hold intermediate-term fixed income in diversified portfolios to pursue ballast and income. The last two-plus years have been frustrating for intermediate-term fixed income investors as bonds have provided negative returns without much ballast. We continue to recommend a patient approach, as all else equal, we expect intermediate-term bonds to provide both ballast and positive returns in the future if yields either stabilize or decline. The strong return since October is a great example of what happens when yields fall. Since October 19th, the 10-Year is down by 111 basis points while the Agg increased by +9.3%.
Intermediate-term bonds are still an attractive investment opportunity in our opinion as the yield to maturity on the US Aggregate Bond index ended the year at 4.5%. Yield to maturity is defined as the estimated annualized rate of return an investor can expect on a bond if purchased today and held to maturity, assuming the issuer makes all their interest and principal payments (i.e., no defaults). In our view, patient investors should be optimistic about intermediate-term fixed income returns over the next several years. Bonds are subject to market and interest rate risk if sold prior to maturity. Bond values will decline as interest rates rise and bonds are subject to availability and change in price.
Please see our Client Question: Bond Primer where we detail bond mechanics, characteristics, types, risks, and historical returns.
Inflation
The increase in inflation since early-2021 was driven by supply chain bottlenecks, surging energy prices, strong consumer demand caused by a solid labor market, and massive amounts of stimulus. Most inflation readings have decelerated from peak levels with several indicators returning to normalized ranges. Given that, the Fed is likely getting ready to declare victory over inflation by lowering interest rates at some point next year.
The Fed has divided inflation into three buckets: goods (prices are now essentially flat as supply chains have normalized), housing (decelerating under rising mortgage rates and just starting to show up in the data), and non-housing related core services (moderating, but still elevated due to the strong labor market and robust wage growth).
The Fed’s latest Summary of Economic Projections show the median participant expects Core PCE Inflation to fall to 2.4% in 2024, 2.2% in 2025, and 2.0% in 2026. Note that the Fed does not have inflation reaching their 2.0% target until 2026.
Here are several key inflation indicators and a chart tracking the data since the start of 2020:
» The Bureau of Labor Statistics Consumer Price Index (CPI) is a measure of the average change over time in the prices paid by urban consumers for a market basket of consumer goods and services. The index includes food and energy prices.
o Latest Reading: 3.1% (November). Peak: 9.1% (June 2022).
» The Core Personal Consumption Expenditure (PCE) Index measures the prices paid by consumers for goods and services based on surveys of what businesses are selling. Core means that the index excludes food and energy prices. This is the Fed’s preferred inflation measure, which they target at an average of 2%.
o Latest Reading: 3.2% (November). Peak: 5.6% (February 2022).
» The Core Producer Price Index (PPI) measures the average change in the selling prices received by domestic producers for their output. The prices included in the PPI are from the first commercial transaction for many products and some services.
o Latest Reading: 2.0% (November). Peak: 9.7% (March 2022).
» The Bureau of Labor Statistics Average Hourly Earnings tracks total hourly renumeration (in cash or in kind) paid to employees in return for work done (or paid leave). Data is from the Current Employment Statistics (CES) survey.
o Latest Reading: 4.0% (November). Peak: 8.1% (April 2020).
» The University of Michigan Inflation Expectations data is based on a monthly survey designed to gauge consumer expectations. Participants are asked for their view on annual inflation over the next 5 to 10 years.
o Latest Reading: 2.9% (December). Peak: 3.1% (January 2022).
Source: Bloomberg
The Fed
The Federal Reserve serves as the central bank of the United States and performs critical functions designed to promote the health of the economy and stability of the financial system. The three key entities include the Board of Governors, twelve Federal Reserve Banks, and the Federal Open Market Committee (FOMC). The FOMC sets monetary policy in accordance with its mandate from Congress: to promote maximum employment, stable prices, and moderate long-term interest rates. According to the Fed, “monetary policy directly affects interest rates; it indirectly affects stock prices, wealth, and currency exchange rates. Through these channels, monetary policy influences spending, investment, production, employment, and inflation in the United States.” Please see our Client Question on The Fed which details the key entities, and the impact monetary policy has on the economy, interest rates, and stock prices.
Interest Rates: The FOMC raised the federal funds rate by 100 basis points (1.00%) total this year before pausing after their July meeting. The top end of the federal funds rate now stands at 5.50%. Since March of 2022, the Fed has increased interest rates by 5.25% total for one of the quickest tightening cycles in United States history. The FOMC’s most recent Summary of Economic Projections (SEP) showed that the median participant expects they will cut rates by 75 basis points to 4.6% in 2024. According to Bloomberg, market pricing indicates a more aggressive view, with about 150 basis points of cuts next year and the first one occurring in March.
Balance Sheet – Quantitative Tightening: The Fed is also reducing the size of their nearly $8 trillion balance sheet. The runoff plan is for monthly caps of about $60 billion for Treasuries and $35 billion for agency mortgage-backed securities. The monthly reduction of about $95 billion is larger than the $50 billion per month pace that was used during the 2017-2019 runoff plan. At the current runoff rate, it will take about 3 more years for the Fed’s balance sheet to decrease to its pre-pandemic size.
The Fed is turning the page after nearly two years of restrictive monetary policy to combat inflation. The Fed’s new focus will be on when to start lowering interest rates in response to moderating inflation. We suspect that the Fed will hold off on cutting interest rates until either of the following scenarios occur:
» The Fed declares victory over inflation. The latest measure of the Fed’s preferred reading, Core PCE Inflation, came in at +3.2% in November, which is still above the Fed’s 2.0% target. The reading likely needs to be under 3% to give the Fed enough confidence that inflation is on a sustained downward trajectory to their 2.0% target. In this scenario, the Fed would cut interest rates so that monetary policy isn’t too restrictive.
» Something breaks in the economy, which causes the Fed to believe that GDP will slow, and that unemployment will rise. We’ve seen the Fed quickly respond to economic shocks by cutting interest rates and turning to accommodative monetary policy.
US Economy
To the surprise of many economists and prognosticators, there was not an economic recession in 2023. Real GDP growth for 2023 is estimated at +2.4%, compared with a forecast of +0.3% at the start of the year. The economy and consumer are still being supported by a strong labor market and excess savings built up since the pandemic. The current consensus estimate is +1.3% for Real GDP growth in 2024.
While we have been pleased with how the economy has performed, there are still reasons for caution. Several recessionary indicators are still flashing yellow or red, including the inverted yield curve, leading economic indicators, and the ISM Manufacturing survey. There is also some evidence that the consumer may be running low on purchasing power. Furthermore, the lagged effect of tighter monetary policy and the resumption of student loan payments will all weigh on near-term economic activity.
We’re taking a wait-and-see approach as the post-pandemic economy has thrown a series of head fakes. At times a recession seemed imminent and at other times we watched as the labor market set new records. Most forecasters who have been consistently calling for a recession have simply moved their predicated start date to 2024. We continue to believe that the key to economic growth going forward is for inflation to become contained so the Fed can stop their tightening cycle before higher interest rates eventually lead to cracks in the labor market and/or the broader economy. Inflation has made significant progress, and the Fed is probably only several months away from lowering rates, but we are not quite out of the woods yet.
Source: Winthrop Wealth, Bloomberg
Outlook
Short-Term: Throughout the year we’ve changed our short-term outlook several times by moving back-and-forth from balanced to cautious in response to evolving market conditions. Our investment style tends to be contrarian in the short term and optimistic over the long term. Over short periods, we often turn cautious when the market gets greedy and extended, and positive when the market declines and investors begin to panic. Markets do not move in straight lines, so we attempt to take advantage of volatility by zigging when the market is zagging. We will generally trim equities or get more defensive when we view the market as extended and add to equities during selloffs. We believe this approach helps our clients navigate volatile markets through a comprehensive and repeatable process. No strategy assures success or protects against loss.
The macroeconomic backdrop is brighter now than it was at the beginning of 2023. Keep in mind that the stock market is a discounting mechanism that looks 6-12 months into the future, meaning that the present environment is already reflected in current equity prices. For the stock market to maintain its positive momentum, we will need another year of economic, inflation, and earnings data that exceed expectations. Putting it all together, we believe maintaining a cautious near-term outlook is prudent as our view is that the fundamentals of the market do not warrant a return to all-time highs yet. In recent years we have seen the market boom-and-bust several times, including 2017 into 2018, 2019 into 2020, and 2021 into 2022. We expect more muted returns and higher volatility in 2024 as the bill for this year’s rally comes due.
Long-term: In our view, investors with a globally diversified portfolio and a long-term time horizon should continue to remain optimistic. Markets have historically increased over time despite frequent drawdowns as successful corporations have been able to figure out ways to generate profits through advances in innovation and productivity. To capitalize on the power of compounding, we believe in the benefits of staying Disciplined, Opportunistic, and Diversified, while striving to Mitigate fees, taxes, and expenses.
» Disciplined: consistently applying our investment process and philosophy, which are grounded in a long-term approach.
» Opportunistic: rebalancing, repositioning, and tax-loss harvesting to take advantage of market volatility and dislocations.
» Diversified: seeking to ensure that portfolios are properly allocated across and among asset classes to enhance consistency.
» Mitigate: striving to avoid unnecessary disbursements, including fees, taxes, and expenses.
In our opinion, adhering to a structured process and executing on all these components should help keep our clients on track toward pursuing their long-term objectives. Historically, equity markets have recovered from recessions and downturns. Past performance is no guarantee of future returns. There is no guarantee that a diversified portfolio will enhance overall returns or outperform a non-diversified portfolio. Diversification does not protect against market risk.
2023 Market Returns
DISCLOSURES
Content in this material is for general information only and not intended to provide specific advice or recommendations for any individual.
The economic forecasts set forth in this material may not develop as predicted and there can be no guarantee that strategies promoted will be successful.
All indexes mentioned are unmanaged indexes which cannot be invested into directly. Unmanaged index returns do not reflect fees, expenses, or sales charges. Index performance is not indicative of the performance of any investment. Past performance is no guarantee of future results.
The Standard & Poor’s 500 Index is a capitalization weighted index of 500 stocks designed to measure performance of the broad domestic economy through changes in the aggregate market value of 500 stocks representing all major industries.
The S&P Midcap 400 Stock Index is an unmanaged index generally representative of the market for the stocks of mid-sized US companies.
The Russell 2000 Index is an unmanaged index generally representative of the 2,000 smallest companies in the Russell 3000 index, which represents approximately 10% of the total market capitalization of the Russell 3000 Index.
The Russell 1000 Growth Index measures the performance of those Russell 1000 companies with higher price-to-book ratios and higher forecasted growth values. Russell 1000 Value Index measures the performance of those Russell 1000 companies with lower price-to-book ratios and lower forecasted growth values.
The Russell 3000 Growth Index is an unmanaged index comprised of those Russell 3000 companies with higher price-to-book ratios and higher forecasted growth values. The Russell 3000 Value Index measures the performance of those Russell 3000 companies with lower price-to-book ratios and lower forecasted growth values.
The prices of small cap stocks and mid cap stocks are generally more volatile than large cap stocks. The MSCI EAFE Index is a free float-adjusted market capitalization index that is designed to measure the equity market performance of developed markets, excluding the US & Canada.
The MSCI EAFE Index consists of the following developed country indices: Australia, Austria, Belgium, Denmark, Finland, France, Germany, Hong Kong, Ireland, Israel, Italy, Japan, the Netherlands, New Zealand, Norway, Portugal, Singapore, Spain, Sweden, Switzerland and the UK.
The MSCI EM (Emerging Markets) Index is a free float-adjusted market capitalization weighted index that is designed to measure the equity market performance of the emerging market countries of the Americas, Europe, the Middle East, Africa and Asia. The MSCI EM Index consists of the following emerging market country indices: Brazil, Chile, Colombia, Mexico, Peru, Czech Republic, Egypt, Greece, Hungary, Poland, Qatar, Russia, South Africa. Turkey, United Arab Emirates, China, India, Indonesia, Korea, Malaysia, Philippines, Taiwan, and Thailand.
The MSCI US Broad Market Index captures broad US equity coverage. The index includes 3,204 constituents across large, mid, small and micro capitalizations, representing about 99% of the US equity universe.
International investing involves special risks such as currency fluctuation and political instability and may not be suitable for all investors. These risks are often heightened for investments in emerging markets.
The Barclays Capital US Corporate High Yield Bond index is an index representative of the universe of fixed-rate, non-investment grade debt.
The Bloomberg Barclays U.S. Aggregate Bond Index is an index of the U.S. investment-grade fixed-rate bond market, including both government and corporate bonds.
The Bloomberg Barclays US Treasury Bills 1-3 Month Index is designed to measure the performance of public obligations of the U.S. Treasury that have a remaining maturity of greater than or equal to 1 month and less than 3 months. The Index includes all publicly issued zero coupon U.S. Treasury Bills that have a remaining maturity of less than 3 months and at least 1 month, are rated investment grade, and have $300 million or more of outstanding face value.
Bonds are subject to market and interest rate risk if sold prior to maturity. Bond values will decline as interest rates rise and bonds are subject to availability and change in price.
Government bonds and Treasury bills are guaranteed by the US government as to the timely payment of principal and interest and, if held to maturity, offer a fixed rate of return and fixed principal value.
Municipal bonds are subject to availability and change in price. They are subject to market and interest rate risk if sold prior to maturity. Bond values will decline as interest rates rise. Interest income may be subject to the alternative minimum tax. Municipal bonds are federally tax-free but other state and local taxes may apply. If sold prior to maturity, capital gains tax could apply.
High yield/junk bonds (grade BB or below) are not investment grade securities, and are subject to higher interest rate, credit, and liquidity risks than those graded BBB and above. They generally should be part of a diversified portfolio for sophisticated investors.
The market value of corporate bonds will fluctuate, and if the bond is sold prior to maturity, the investor’s yield may differ from the advertised yield.
Financial planning is a tool intended to review your current financial situation, investment objectives and goals, and suggest potential planning ideas and concepts that may be of benefit. There is no guarantee that financial planning will help you reach your goals.
Asset allocation does not ensure a profit or protect against loss. There is no guarantee that a diversified portfolio will enhance overall returns or outperform a non-diversified portfolio.
Diversification does not protect against market risk. All investing involves risk which you should be prepared to bear.
Securities offered through LPL Financial, Member FINRA/SIPC. Investment Advice offered through Winthrop Wealth, a Registered Investment Advisor and separate entity from LPL Financial.