Markets entered February riding nine consecutive months of gains, then paused. A sharp rotation away from mega-cap technology, renewed tariff uncertainty, a pending Federal Reserve leadership transition, and resilient but cautious labor market data defined the month. Co-Chief Investment Officer Andrew Murphy, CFA, breaks down what happened and how we are thinking about it.
After nine consecutive monthly gains, the S&P 500 declined modestly in February, falling -0.8%. Year-to-date, the index remains higher by +0.7%. Beneath the headline move, renewed concerns around AI disruption drove a notable rotation away from mega-cap growth stocks and toward broader market leadership, including value stocks, international markets, and cyclical sectors such as Industrials, Energy, and Materials. Despite this rotation, long-term market performance remains strong, with the S&P 500 up nearly +102% since the start of the current bull market in October 2022. Market performance in recent months reinforces our belief in the importance of maintaining a disciplined long-term perspective. Please see our Principles for Long-Term Investing.
AI Disruption Fears Shake Industries
AI disruption concerns are moving rapidly through the market, with headlines triggering sudden selloffs across entire industries. Software has been hit hardest, as investors worry that advances in next-generation AI systems could commoditize core functionality and compress long-term growth assumptions. Cybersecurity, Insurance, Real Estate, Financial Services, Alternative Investments, and IT Services and Consulting companies have also declined on fears that their business models are under structural threat. The reality is that no one yet knows how this ultimately plays out. Some companies and industries may face lasting pressure, while others may use AI to enhance productivity and deepen customer relationships. We expect volatility tied to the AI disruption narrative to continue, likely creating both permanent reratings in certain areas and long-term opportunities in others.
Tariff Update and Ongoing Uncertainty
The Supreme Court ruled that the President lacked authority to impose tariffs under the International Emergency Economic Powers Act, striking down the broad reciprocal tariffs implemented last year. Within hours, President Trump announced a new 15% global tariff under Section 122 of the Trade Act of 1974, set to expire in late July unless extended by Congress. While the ruling modestly reduced the effective tariff rate, tariffs remain meaningfully higher than at the start of 2025 and are unlikely to disappear as a policy tool. Questions remain regarding potential refunds, what happens after July, and whether other trade authorities will be used. As a result, tariffs remain an ongoing source of policy uncertainty and market volatility.
Market Leadership and Dispersion
February highlighted meaningful performance dispersion beneath the surface. The Magnificent 7 declined approximately -7.3% during the month, with Microsoft (-8.5%), Nvidia (-7.3%), and Amazon (-12.2%) posting notable post-earnings weakness, underscoring how sensitive mega-cap technology stocks remain to shifting AI expectations. In contrast, value stocks (Russell 1000 Value: +2.6%) outperformed growth (Russell 1000 Growth: -3.4%), mid-cap stocks (S&P 400: +4.1%) advanced, and international equities (ACWI ex US: +5.0%) posted strong gains. Cyclical sectors such as Energy (+9.4%) and Materials (+8.4%) led the market, while defensive Utilities (+10.4%) also outperformed as investors diversified away from concentrated mega-cap exposure.
We construct diversified portfolios across regions, market caps, styles, and sectors, tilting toward areas we believe offer the most potential benefit. Our view remains that diversification can help deliver more consistent and less volatile results than an all-eggs-in-one-basket approach. There is no guarantee that a diversified portfolio will enhance overall returns or outperform a non-diversified portfolio. Diversification does not protect against market risk.
Short-Term Outlook: Our short-term outlook remains measured as markets navigate heightened dispersion, policy uncertainty, and evolving geopolitical risks. Corporate earnings remain solid overall, and the labor market has shown resilience, though uncertainty tied to AI disruption, tariff-related developments, and the transition to a new Fed leadership regime introduces additional complexity. In this environment, we believe it is prudent to remain disciplined by continuing regular rebalancing toward long-term targets, opportunistically raising cash for distributions, and positioning portfolios to manage downside risk while remaining prepared to participate in potential upside. Key factors we are monitoring include developments in artificial intelligence and capital spending, trade and geopolitical dynamics, the evolution of monetary policy under new Fed leadership, shifting market leadership, and the overall health of the labor market.
Long-Term Philosophy: We apply a Total Net Worth Approach to wealth management that integrates comprehensive financial planning with a structured investment process. Markets have historically increased over time despite frequent drawdowns as successful corporations generate profits through advances in innovation and productivity. To capitalize on the power of compounding, we believe in the benefits of staying Disciplined, Opportunistic, and Diversified, while striving to Mitigate fees, taxes, and expenses.
Historically, equity markets have recovered from recessions and downturns. Past performance is no guarantee of future returns. There is no guarantee that a diversified portfolio will enhance overall returns or outperform a non-diversified portfolio. Diversification does not protect against market risk. All data sourced from Bloomberg as of 2/28/26.
Fixed Income Markets
Interest Rates
Long-term Treasury yields declined in February due to softer CPI inflation data and a flight-to-safety amid geopolitical uncertainty and concerns that, despite recent strong labor data, AI disruption could ultimately weigh on the labor market and broader growth.
Short-Term Treasury Yields: The Federal Reserve influences short-term interest rates by setting the Federal Funds rate.
According to Bloomberg, market pricing indicates about two 0.25% rate cuts this year, so short-term yields should continue modestly to decline in the coming months.
Investing in short-term Treasuries with 4%-5% yields was a great strategy over the past few years, but we believe that opportunity has passed, and investors now face reinvestment risk with lower rates at maturity. We suggest using short-term Treasuries to fund anticipated liabilities, and to invest any excess cash in longer maturities or in a diversified portfolio. Investing involves risk including loss of principal. No strategy assures success or protects against loss.
Long-Term Treasury Yields: The market determines long-term yields based on supply dynamics, including elevated federal debt issuance, and investor demand, which vary with expectations for future inflation and economic growth.
As a reminder, mortgage rates are more closely correlated with the 10-Year Treasury yield than with the Federal Funds rate. The average 30-year mortgage rate has declined to approximately 6.14%, its lowest level since the fall of 2022. From here, the direction of long-term yields will likely be more important than additional Fed policy moves.
Intermediate-Term Bonds
The Bloomberg US Aggregate Bond Index (Agg), which serves as a proxy for the intermediate-term investment-grade bond market, increased by +1.6% due to the decline in long-term yields. The year-to-date return of the Agg is now +1.7%. Bond prices move inversely to interest rates and credit spreads. Please see our Bond Primer.
After some challenging periods over the last few years, we are pleased to see solid returns from intermediate-term bonds. All else equal, we still expect intermediate-term bonds to provide both ballast and positive returns as yields either stabilize or decline. Bonds did provide ballast during the recent bout of market volatility last year, gaining +1% while the equity market declined by nearly -19%. We’ll also highlight that bonds performed well in a relatively stable rate environment: since mid-October 2022, the 10-Year Treasury yield has started and ended the period at roughly 3.9%, while the Agg delivered a +20.1% total return (+5.6% annualized).
In our opinion, intermediate-term bonds continue to offer a competitive expected return profile compared to recent history, as the yield to maturity on the US Aggregate Bond Index ended the month at 4.2%. Yield to maturity is defined as the estimated annualized rate of return an investor can expect on a bond if purchased today and held to maturity, assuming the issuer makes all their interest and principal payments (i.e., no defaults). Bonds are subject to market and interest rate risk if sold prior to maturity. Bond values will decline as interest rates rise and bonds are subject to availability and change in price.
Source: Bloomberg.
Monetary Policy
“The Fed’s bloated balance sheet, designed to support the biggest firms in a bygone crisis era, can be reduced significantly. That largesse can be redeployed in the form of lower interest rates to support households and small and medium-size businesses.” — Fed Chair Nominee Kevin Warsh, Wall Street Journal (November 2025)
With no FOMC meeting held during February, market attention shifted toward the upcoming leadership transition at the Federal Reserve. President Trump’s nomination of Kevin Warsh to succeed Chair Jerome Powell has been announced, though the Senate confirmation process has not yet formally begun. The timeline could be delayed as some senators have indicated they may withhold action until the Department of Justice investigation involving current Fed Chair Jerome Powell is resolved.
Warsh previously served as a Federal Reserve governor from 2006 to 2011 and played a role in coordinating the Fed’s response to the 2008 financial crisis. He has long expressed concern about the size of the Fed’s balance sheet, which currently stands at approximately $6.6 trillion, arguing that an expanded balance sheet can distort asset prices and weaken long-term policy credibility. At the same time, his recent public remarks suggest openness to lower short-term interest rates if structural forces such as productivity gains and deregulation help ease inflation pressures.
Federal Reserve independence is top of mind given the President’s past public comments regarding monetary policy and the upcoming FOMC leadership transition. Importantly, the Federal Reserve remains a committee driven institution. While the Chair plays a significant role in shaping the agenda and communicating policy, monetary decisions are determined collectively by the Federal Open Market Committee. According to Bloomberg, market pricing currently reflects expectations for approximately two 0.25% rate cuts in 2026, with the first likely occurring at the June meeting, which would be the new Fed Chair’s first meeting. We continue to believe that an independent and credible Federal Reserve is essential to maintaining confidence in monetary policy and the stability of financial markets.
US Economy
“Recent data readings such as those for the unemployment rate, layoffs, and job openings suggested that labor market conditions may be stabilizing after a period of gradual cooling. Business contacts continued to express caution in hiring decisions, reflecting uncertainty about the economic outlook and the effect of AI and other automation technologies on the labor market.” — Minutes of the Federal Open Market Committee (January 27-28, 2026)
Economic data during the month pointed to continued expansion, though with some noise in the headline numbers. Fourth quarter 2025 GDP grew at +1.4%, below the +2.8% estimate and down from +4.4% in the prior quarter. Importantly, personal consumption, which represents roughly 70% of GDP, increased +2.4% and matched expectations. In our view, the underlying trend remains intact so long as the labor market continues to stabilize. Real GDP is currently estimated at roughly +2.5% in 2026 and +2.0% in 2027.
Labor market data have shown encouraging signs of improvement. The unemployment rate declined to 4.3% from 4.5% in November, and the January BLS employment report showed the economy added +130,000 jobs, the strongest reading since December 2024. Weekly jobless claims data have also improved and are running stronger than their one year averages. Consumer spending continues to be supported by households at the upper end of the income spectrum, with Federal Reserve data showing US household and nonprofit net worth at a record of approximately $182 trillion as of September. At the same time, uncertainty tied to AI and automation remains an overhang on hiring and investment decisions. While productivity gains could ultimately support growth, the pace of technological change may influence hiring decisions, which in turn could affect labor market momentum and consumer spending over time.Source: Bloomberg.
February 2026 Market Returns
Source: Bloomberg.
DISCLOSURES
Content in this material is for general information only and not intended to provide specific advice or recommendations for any individual.
The economic forecasts set forth in this material may not develop as predicted and there can be no guarantee that strategies pro- moted will be successful.
All indexes mentioned are unmanaged indexes which cannot be invested into directly. Unmanaged index returns do not reflect fees, expenses, or sales charges. Index performance is not indicative of the performance of any investment. Past performance is no guarantee of future results.
The Standard & Poor’s 500 Index is a capitalization weighted index of 500 stocks designed to measure performance of the broad domestic economy through changes in the aggregate market value of 500 stocks representing all major industries.
The S&P Midcap 400 Stock Index is an unmanaged index generally representative of the market for the stocks of mid-sized US companies.
The Russell 2000 Index is an unmanaged index generally representative of the 2,000 smallest companies in the Russell 3000 index, which represents approximately 10% of the total market capitalization of the Russell 3000 Index.
The Russell 1000 Growth Index measures the performance of those Russell 1000 companies with higher price-to-book ratios and higher forecasted growth values. Russell 1000 Value Index measures the performance of those Russell 1000 companies with lower price-to-book ratios and lower forecasted growth values.
The Russell 3000 Growth Index is an unmanaged index comprised of those Russell 3000 companies with higher price-to-book ratios and higher forecasted growth values. The Russell 3000 Value Index measures the performance of those Russell 3000 com- panies with lower price-to-book ratios and lower forecasted growth values.
The prices of small cap stocks and mid cap stocks are generally more volatile than large cap stocks. The MSCI EAFE Index is a free float-adjusted market capitalization index that is designed to measure the equity market performance of developed markets, excluding the US & Canada.
The MSCI EAFE Index consists of the following developed country indices: Australia, Austria, Belgium, Denmark, Finland, France, Germany, Hong Kong, Ireland, Israel, Italy, Japan, the Netherlands, New Zealand, Norway, Portugal, Singapore, Spain, Sweden, Switzerland and the UK.
The MSCI EM (Emerging Markets) Index is a free float-adjusted market capitalization weighted index that is designed to measure the equity market performance of the emerging market countries of the Americas, Europe, the Middle East, Africa and Asia. The MSCI EM Index consists of the following emerging market country indices: Brazil, Chile, Colombia, Mexico, Peru, Czech Republic, Egypt, Greece, Hungary, Poland, Qatar, Russia, South Africa. Turkey, United Arab Emirates, China, India, Indonesia, Korea, Malaysia, Philippines, Taiwan, and Thailand.
The MSCI US Broad Market Index captures broad US equity coverage. The index includes 3,204 constituents across large, mid, small and micro capitalizations, representing about 99% of the US equity universe.
International investing involves special risks such as currency fluctuation and political instability and may not be suitable for all investors. These risks are often heightened for investments in emerging markets.
The Barclays Capital US Corporate High Yield Bond index is an index representative of the universe of fixed-rate, non-investment grade debt.
The Bloomberg Barclays US Aggregate Bond Index is a broad-based flagship benchmark that measures the investment grade, US dollar-denominated, fixed-rate taxable bond market.
The Bloomberg Barclays US Treasury Bills 1-3 Month Index is designed to measure the performance of public obligations of the U.S. Treasury that have a remaining maturity of greater than or equal to 1 month and less than 3 months. The Index includes all publicly issued zero coupon U.S. Treasury Bills that have a remaining maturity of less than 3 months and at least 1 month, are rated investment grade, and have $300 million or more of outstanding face value.
Bonds are subject to market and interest rate risk if sold prior to maturity. Bond values will decline as interest rates rise and bonds are subject to availability and change in price.
Government bonds and Treasury bills are guaranteed by the US government as to the timely payment of principal and interest and, if held to maturity, offer a fixed rate of return and fixed principal value.
Municipal bonds are subject to availability and change in price. They are subject to market and interest rate risk if sold prior to maturity. Bond values will decline as interest rates rise. Interest income may be subject to the alternative minimum tax. Municipal bonds are federally tax-free but other state and local taxes may apply. If sold prior to maturity, capital gains tax could apply.
High yield/junk bonds (grade BB or below) are not investment grade securities, and are subject to higher interest rate, credit, and liquidity risks than those graded BBB and above. They generally should be part of a diversified portfolio for sophisticated investors.
The market value of corporate bonds will fluctuate, and if the bond is sold prior to maturity, the investor’s yield may differ from the advertised yield.
Asset allocation does not ensure a profit or protect against loss. There is no guarantee that a diversified portfolio will enhance overall returns or outperform a non-diversified portfolio.


< COMMENTARY
Market Commentary | March 02, 2026
February 2026 Market Recap | Winthrop Wealth
By Andrew Murphy, CFA
Co-Chief Investment Officer
Markets entered February riding nine consecutive months of gains, then paused. A sharp rotation away from mega-cap technology, renewed tariff uncertainty, a pending Federal Reserve leadership transition, and resilient but cautious labor market data defined the month. Co-Chief Investment Officer Andrew Murphy, CFA, breaks down what happened and how we are thinking about it.
PRINT/DOWNLOAD
February 2026 RecapAfter nine consecutive monthly gains, the S&P 500 declined modestly in February, falling -0.8%. Year-to-date, the index remains higher by +0.7%. Beneath the headline move, renewed concerns around AI disruption drove a notable rotation away from mega-cap growth stocks and toward broader market leadership, including value stocks, international markets, and cyclical sectors such as Industrials, Energy, and Materials. Despite this rotation, long-term market performance remains strong, with the S&P 500 up nearly +102% since the start of the current bull market in October 2022. Market performance in recent months reinforces our belief in the importance of maintaining a disciplined long-term perspective. Please see our Principles for Long-Term Investing.
AI Disruption Fears Shake Industries
AI disruption concerns are moving rapidly through the market, with headlines triggering sudden selloffs across entire industries. Software has been hit hardest, as investors worry that advances in next-generation AI systems could commoditize core functionality and compress long-term growth assumptions. Cybersecurity, Insurance, Real Estate, Financial Services, Alternative Investments, and IT Services and Consulting companies have also declined on fears that their business models are under structural threat. The reality is that no one yet knows how this ultimately plays out. Some companies and industries may face lasting pressure, while others may use AI to enhance productivity and deepen customer relationships. We expect volatility tied to the AI disruption narrative to continue, likely creating both permanent reratings in certain areas and long-term opportunities in others.
Tariff Update and Ongoing Uncertainty
The Supreme Court ruled that the President lacked authority to impose tariffs under the International Emergency Economic Powers Act, striking down the broad reciprocal tariffs implemented last year. Within hours, President Trump announced a new 15% global tariff under Section 122 of the Trade Act of 1974, set to expire in late July unless extended by Congress. While the ruling modestly reduced the effective tariff rate, tariffs remain meaningfully higher than at the start of 2025 and are unlikely to disappear as a policy tool. Questions remain regarding potential refunds, what happens after July, and whether other trade authorities will be used. As a result, tariffs remain an ongoing source of policy uncertainty and market volatility.
Market Leadership and Dispersion
February highlighted meaningful performance dispersion beneath the surface. The Magnificent 7 declined approximately -7.3% during the month, with Microsoft (-8.5%), Nvidia (-7.3%), and Amazon (-12.2%) posting notable post-earnings weakness, underscoring how sensitive mega-cap technology stocks remain to shifting AI expectations. In contrast, value stocks (Russell 1000 Value: +2.6%) outperformed growth (Russell 1000 Growth: -3.4%), mid-cap stocks (S&P 400: +4.1%) advanced, and international equities (ACWI ex US: +5.0%) posted strong gains. Cyclical sectors such as Energy (+9.4%) and Materials (+8.4%) led the market, while defensive Utilities (+10.4%) also outperformed as investors diversified away from concentrated mega-cap exposure.
Short-Term Outlook: Our short-term outlook remains measured as markets navigate heightened dispersion, policy uncertainty, and evolving geopolitical risks. Corporate earnings remain solid overall, and the labor market has shown resilience, though uncertainty tied to AI disruption, tariff-related developments, and the transition to a new Fed leadership regime introduces additional complexity. In this environment, we believe it is prudent to remain disciplined by continuing regular rebalancing toward long-term targets, opportunistically raising cash for distributions, and positioning portfolios to manage downside risk while remaining prepared to participate in potential upside. Key factors we are monitoring include developments in artificial intelligence and capital spending, trade and geopolitical dynamics, the evolution of monetary policy under new Fed leadership, shifting market leadership, and the overall health of the labor market.
Long-Term Philosophy: We apply a Total Net Worth Approach to wealth management that integrates comprehensive financial planning with a structured investment process. Markets have historically increased over time despite frequent drawdowns as successful corporations generate profits through advances in innovation and productivity. To capitalize on the power of compounding, we believe in the benefits of staying Disciplined, Opportunistic, and Diversified, while striving to Mitigate fees, taxes, and expenses.
Historically, equity markets have recovered from recessions and downturns. Past performance is no guarantee of future returns. There is no guarantee that a diversified portfolio will enhance overall returns or outperform a non-diversified portfolio. Diversification does not protect against market risk. All data sourced from Bloomberg as of 2/28/26.
Fixed Income Markets
Interest Rates
Long-term Treasury yields declined in February due to softer CPI inflation data and a flight-to-safety amid geopolitical uncertainty and concerns that, despite recent strong labor data, AI disruption could ultimately weigh on the labor market and broader growth.
Short-Term Treasury Yields: The Federal Reserve influences short-term interest rates by setting the Federal Funds rate.
Long-Term Treasury Yields: The market determines long-term yields based on supply dynamics, including elevated federal debt issuance, and investor demand, which vary with expectations for future inflation and economic growth.
Intermediate-Term Bonds
The Bloomberg US Aggregate Bond Index (Agg), which serves as a proxy for the intermediate-term investment-grade bond market, increased by +1.6% due to the decline in long-term yields. The year-to-date return of the Agg is now +1.7%. Bond prices move inversely to interest rates and credit spreads. Please see our Bond Primer.
After some challenging periods over the last few years, we are pleased to see solid returns from intermediate-term bonds. All else equal, we still expect intermediate-term bonds to provide both ballast and positive returns as yields either stabilize or decline. Bonds did provide ballast during the recent bout of market volatility last year, gaining +1% while the equity market declined by nearly -19%. We’ll also highlight that bonds performed well in a relatively stable rate environment: since mid-October 2022, the 10-Year Treasury yield has started and ended the period at roughly 3.9%, while the Agg delivered a +20.1% total return (+5.6% annualized).
In our opinion, intermediate-term bonds continue to offer a competitive expected return profile compared to recent history, as the yield to maturity on the US Aggregate Bond Index ended the month at 4.2%. Yield to maturity is defined as the estimated annualized rate of return an investor can expect on a bond if purchased today and held to maturity, assuming the issuer makes all their interest and principal payments (i.e., no defaults). Bonds are subject to market and interest rate risk if sold prior to maturity. Bond values will decline as interest rates rise and bonds are subject to availability and change in price.
Monetary Policy
With no FOMC meeting held during February, market attention shifted toward the upcoming leadership transition at the Federal Reserve. President Trump’s nomination of Kevin Warsh to succeed Chair Jerome Powell has been announced, though the Senate confirmation process has not yet formally begun. The timeline could be delayed as some senators have indicated they may withhold action until the Department of Justice investigation involving current Fed Chair Jerome Powell is resolved.
Warsh previously served as a Federal Reserve governor from 2006 to 2011 and played a role in coordinating the Fed’s response to the 2008 financial crisis. He has long expressed concern about the size of the Fed’s balance sheet, which currently stands at approximately $6.6 trillion, arguing that an expanded balance sheet can distort asset prices and weaken long-term policy credibility. At the same time, his recent public remarks suggest openness to lower short-term interest rates if structural forces such as productivity gains and deregulation help ease inflation pressures.
Federal Reserve independence is top of mind given the President’s past public comments regarding monetary policy and the upcoming FOMC leadership transition. Importantly, the Federal Reserve remains a committee driven institution. While the Chair plays a significant role in shaping the agenda and communicating policy, monetary decisions are determined collectively by the Federal Open Market Committee. According to Bloomberg, market pricing currently reflects expectations for approximately two 0.25% rate cuts in 2026, with the first likely occurring at the June meeting, which would be the new Fed Chair’s first meeting. We continue to believe that an independent and credible Federal Reserve is essential to maintaining confidence in monetary policy and the stability of financial markets.
US Economy
Economic data during the month pointed to continued expansion, though with some noise in the headline numbers. Fourth quarter 2025 GDP grew at +1.4%, below the +2.8% estimate and down from +4.4% in the prior quarter. Importantly, personal consumption, which represents roughly 70% of GDP, increased +2.4% and matched expectations. In our view, the underlying trend remains intact so long as the labor market continues to stabilize. Real GDP is currently estimated at roughly +2.5% in 2026 and +2.0% in 2027.
Labor market data have shown encouraging signs of improvement. The unemployment rate declined to 4.3% from 4.5% in November, and the January BLS employment report showed the economy added +130,000 jobs, the strongest reading since December 2024. Weekly jobless claims data have also improved and are running stronger than their one year averages. Consumer spending continues to be supported by households at the upper end of the income spectrum, with Federal Reserve data showing US household and nonprofit net worth at a record of approximately $182 trillion as of September. At the same time, uncertainty tied to AI and automation remains an overhang on hiring and investment decisions. While productivity gains could ultimately support growth, the pace of technological change may influence hiring decisions, which in turn could affect labor market momentum and consumer spending over time.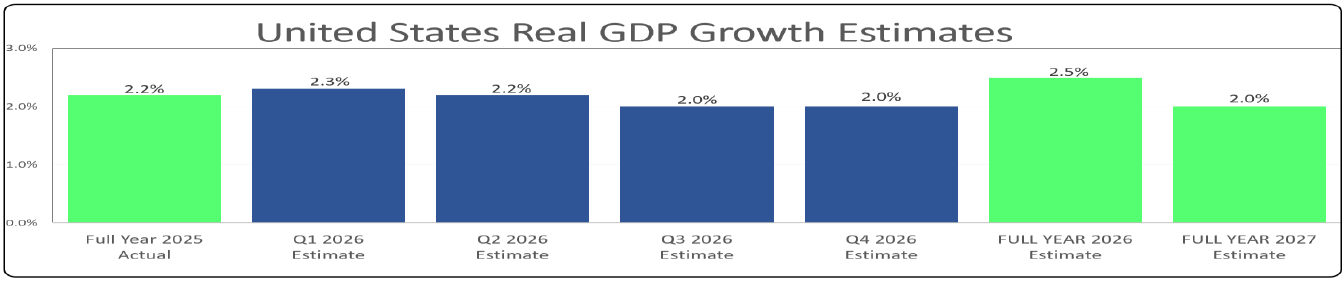 Source: Bloomberg.
February 2026 Market Returns
DISCLOSURES
Content in this material is for general information only and not intended to provide specific advice or recommendations for any individual.
The economic forecasts set forth in this material may not develop as predicted and there can be no guarantee that strategies pro- moted will be successful.
All indexes mentioned are unmanaged indexes which cannot be invested into directly. Unmanaged index returns do not reflect fees, expenses, or sales charges. Index performance is not indicative of the performance of any investment. Past performance is no guarantee of future results.
The Standard & Poor’s 500 Index is a capitalization weighted index of 500 stocks designed to measure performance of the broad domestic economy through changes in the aggregate market value of 500 stocks representing all major industries.
The S&P Midcap 400 Stock Index is an unmanaged index generally representative of the market for the stocks of mid-sized US companies.
The Russell 2000 Index is an unmanaged index generally representative of the 2,000 smallest companies in the Russell 3000 index, which represents approximately 10% of the total market capitalization of the Russell 3000 Index.
The Russell 1000 Growth Index measures the performance of those Russell 1000 companies with higher price-to-book ratios and higher forecasted growth values. Russell 1000 Value Index measures the performance of those Russell 1000 companies with lower price-to-book ratios and lower forecasted growth values.
The Russell 3000 Growth Index is an unmanaged index comprised of those Russell 3000 companies with higher price-to-book ratios and higher forecasted growth values. The Russell 3000 Value Index measures the performance of those Russell 3000 com- panies with lower price-to-book ratios and lower forecasted growth values.
The prices of small cap stocks and mid cap stocks are generally more volatile than large cap stocks. The MSCI EAFE Index is a free float-adjusted market capitalization index that is designed to measure the equity market performance of developed markets, excluding the US & Canada.
The MSCI EAFE Index consists of the following developed country indices: Australia, Austria, Belgium, Denmark, Finland, France, Germany, Hong Kong, Ireland, Israel, Italy, Japan, the Netherlands, New Zealand, Norway, Portugal, Singapore, Spain, Sweden, Switzerland and the UK.
The MSCI EM (Emerging Markets) Index is a free float-adjusted market capitalization weighted index that is designed to measure the equity market performance of the emerging market countries of the Americas, Europe, the Middle East, Africa and Asia. The MSCI EM Index consists of the following emerging market country indices: Brazil, Chile, Colombia, Mexico, Peru, Czech Republic, Egypt, Greece, Hungary, Poland, Qatar, Russia, South Africa. Turkey, United Arab Emirates, China, India, Indonesia, Korea, Malaysia, Philippines, Taiwan, and Thailand.
The MSCI US Broad Market Index captures broad US equity coverage. The index includes 3,204 constituents across large, mid, small and micro capitalizations, representing about 99% of the US equity universe.
International investing involves special risks such as currency fluctuation and political instability and may not be suitable for all investors. These risks are often heightened for investments in emerging markets.
The Barclays Capital US Corporate High Yield Bond index is an index representative of the universe of fixed-rate, non-investment grade debt.
The Bloomberg Barclays US Aggregate Bond Index is a broad-based flagship benchmark that measures the investment grade, US dollar-denominated, fixed-rate taxable bond market.
The Bloomberg Barclays US Treasury Bills 1-3 Month Index is designed to measure the performance of public obligations of the U.S. Treasury that have a remaining maturity of greater than or equal to 1 month and less than 3 months. The Index includes all publicly issued zero coupon U.S. Treasury Bills that have a remaining maturity of less than 3 months and at least 1 month, are rated investment grade, and have $300 million or more of outstanding face value.
Bonds are subject to market and interest rate risk if sold prior to maturity. Bond values will decline as interest rates rise and bonds are subject to availability and change in price.
Government bonds and Treasury bills are guaranteed by the US government as to the timely payment of principal and interest and, if held to maturity, offer a fixed rate of return and fixed principal value.
Municipal bonds are subject to availability and change in price. They are subject to market and interest rate risk if sold prior to maturity. Bond values will decline as interest rates rise. Interest income may be subject to the alternative minimum tax. Municipal bonds are federally tax-free but other state and local taxes may apply. If sold prior to maturity, capital gains tax could apply.
High yield/junk bonds (grade BB or below) are not investment grade securities, and are subject to higher interest rate, credit, and liquidity risks than those graded BBB and above. They generally should be part of a diversified portfolio for sophisticated investors.
The market value of corporate bonds will fluctuate, and if the bond is sold prior to maturity, the investor’s yield may differ from the advertised yield.
Asset allocation does not ensure a profit or protect against loss. There is no guarantee that a diversified portfolio will enhance overall returns or outperform a non-diversified portfolio.