November saw modest equity gains, a late-month rally driven by shifting rate expectations, and a reshaping of AI leadership. Market froth continued to cool, economic data softened, and falling Treasury yields supported fixed income—setting the stage for a disciplined outlook heading into year-end.
The US equity market recorded a modest +0.2% gain in November, moving into positive territory on the final trading day of the month. This marks the seventh consecutive monthly advance for the S&P 500, tied for the longest winning streak since 2021. Year-to-date, the index is up +17.8%, driven by progress on trade deals and easing tariff uncertainty, stronger-than-expected corporate earnings, sustained optimism around artificial intelligence, and the Fed’s recent rate cuts.
-5% Decline, Followed by Month-End Rally: The S&P 500 experienced its third -5% drawdown of 2025 as the index fell by roughly that amount from the end of October through November 20th. From there, the market staged a +4.8% rally into month-end following comments from New York Fed President John Williams that set the stage for another interest rate cut in December. In context, this recent volatility is minor compared to the near bear market in early April. Since that low, the index has gained nearly +39%. Market performance in recent months reinforces our belief in the importance of maintaining a disciplined long-term perspective. Please see our Principles for Long-Term Investing.
AI Leadership Shakeup: Investors became notably more discerning with AI-exposed stocks in November. Nvidia (-12.6%) and Microsoft (-4.8%) declined as investors grew increasingly concerned about potential circular financing risks tied to OpenAI and the broader AI funding ecosystem, while Oracle (-23.1%) plunged amid unease over its expanding reliance on debt issuance to support infrastructure build-out. In contrast, Alphabet (+13.6%) is emerging as a strong contender at the top of the AI race on positive developments related to its Gemini large language model and continued progress with its proprietary TPU semiconductor chips, which may soon be offered to external customers and could potentially take market share from Nvidia. Overall, the month signaled a shift away from indiscriminate enthusiasm and toward a more selective posture, with early signs of new leadership within the AI trade.
Sector and Style Scoreboard: The weakness across several mega-cap growth names noted above contributed to Value (+2.7%) outperforming Growth (-1.8%). Sector performance further reflected this shift, with Technology (-4.3%) and Consumer Discretionary (-2.4%) lagging, while more defensive areas such as Health Care (+9.3%) led the market higher.
Signs of Froth Abate: We’ve highlighted growing signs of froth over the last few months, and several of these moderated in November. Bitcoin experienced a near -28% peak-to-trough decline, and speculative appetite cooled across multiple high-risk baskets, including Meme Stocks (-9.0%), Non-Profitable Technology (-11.5%), and Quantum Computing (-29.1%). We view this as a healthy development that reflects a more sustainable and balanced market environment.
Short-Term Outlook: Our short-term outlook remains cautious despite some moderating signs of froth amid the first meaningful bout of market volatility since April. On the positive side, corporate earnings remain solid with continued upward revisions, and there has been selective cooling across speculative areas, helping support a more stable foundation for equities. However, the month-end rally was largely driven by shifting expectations around further rate cuts rather than improving economic momentum. Additionally, the market has only recently begun applying a more critical lens to AI — the primary driver of the bull market over the past three years — introducing greater uncertainty around the durability of recent gains. In our view, it is prudent to remain disciplined by expecting elevated volatility, staying committed to regular rebalancing toward long-term targets, and using this environment to opportunistically raise cash for upcoming distributions or future goals.
Long-Term Philosophy: We apply a Total Net Worth Approach to wealth management that integrates comprehensive financial planning with a structured investment process. Markets have historically increased over time despite frequent drawdowns as successful corporations generate profits through advances in innovation and productivity. To capitalize on the power of compounding, we believe in the benefits of staying Disciplined, Opportunistic, and Diversified, while striving to Mitigate fees, taxes, and expenses.
In our opinion, adhering to a structured process and executing on all these components should help keep our clients on track toward pursuing their long-term objectives. Historically, equity markets have recovered from recessions and downturns. Past performance is no guarantee of future returns. There is no guarantee that a diversified portfolio will enhance overall returns or outperform a non-diversified portfolio. Diversification does not protect against market risk.
All data sourced from Bloomberg as of 11/30/2025
Fixed Income Markets
Interest Rates
Interest rates fell modestly across the Treasury curve in November as concerns over a softening labor market and comments from New York Fed President John Williams reinforced expectations for another rate cut in December.
Short-Term Treasury Yields: The Federal Reserve influences short-term interest rates by setting the Federal Funds rate.
According to Bloomberg, market pricing indicates about three additional 0.25% rate cuts over the next year, so short-term yields should decline further in the coming months.
Investing in short-term Treasuries with 4%-5% yields was a great strategy over the past few years, but we believe that opportunity has passed, and investors now face reinvestment risk with lower rates at maturity. We suggest using short-term Treasuries to fund anticipated liabilities, and to invest any excess cash in longer maturities or in a diversified portfolio. Investing involves risk including loss of principal. No strategy assures success or protects against loss.
Long-Term Treasury Yields: The market determines long-term yields based on supply dynamics, including elevated federal debt issuance, and investor demand, which vary with expectations for future inflation and economic growth.
As a reminder, mortgage rates are more closely correlated with the 10-Year Treasury yield than with the Federal Funds rate. Investors should not assume mortgage rates will fall simply because the Fed is cutting. In late 2024, the Fed lowered rates by 1.0%, yet the 10-Year yield rose +1.1% and mortgage rates climbed +0.8% as markets priced in higher inflation and growth.
Intermediate-Term Bonds
The Bloomberg US Aggregate Bond index (Agg), which acts as a proxy for the intermediate-term investment-grade bond market, increased by +0.6% due to the decline in the 10-Year Treasury yield. Bond prices move inversely to interest rates and credit spreads. The Agg is now higher by +7.5% in 2025. Please see our Bond Primer.
After some challenging periods over the last few years, we are pleased to see solid returns from intermediate-term bonds. All else equal, we still expect intermediate-term bonds to provide both ballast and positive returns as yields either stabilize or decline. Bonds did provide ballast during the recent bout of market volatility earlier this year, gaining +1% while the equity market declined by nearly -19%. We’ll also highlight that bonds performed well in a relatively stable rate environment: since mid-October 2022, the 10-Year Treasury yield has started and ended the period at roughly 4%, while the Agg delivered an +18.7% total return (+5.6% annualized).
In our opinion, intermediate-term bonds remain an attractive investment opportunity, as the yield to maturity on the US Aggregate Bond Index ended the month at 4.3%. Yield to maturity is defined as the estimated annualized rate of return an investor can expect on a bond if purchased today and held to maturity, assuming the issuer makes all their interest and principal payments (i.e., no defaults). Bonds are subject to market and interest rate risk if sold prior to maturity. Bond values will decline as interest rates rise and bonds are subject to availability and change in price.Source: Bloomberg.
Monetary Policy
“I view monetary policy as being modestly restrictive, although somewhat less so than before our recent actions. Therefore, I still see room for a further adjustment in the near term to the target range for the Federal Funds rate to move the stance of policy closer to the range of neutral.”
– John Williams, New York Fed President, Central Bank of Chile Centennial Conference (November 2025)
As there was no Federal Open Market Committee (FOMC) meeting this month, the key Federal Reserve development came from dovish comments by New York Fed President John Williams, which triggered a sharp repricing of near-term rate expectations and a risk-on response in markets. Williams, widely viewed as the second most influential member of the committee behind Chair Powell, described monetary policy as “modestly restrictive” and suggested there is still room for a further adjustment in the near term to move policy closer to neutral. Following his remarks, the implied odds of a December rate cut surged from roughly 25% to approximately 80%, helping drive a +4.2% equity rally into month end. Upcoming FOMC meetings are scheduled for December 10th, January 28th, and March 18th.
While the timing of the next rate cut in December or January is unlikely to materially alter total equity returns over the next six months, it carries meaningful implications for short-term market dynamics. A December rate cut would meaningfully increase the probability of a traditional year-end “Santa Claus rally,” which may have already been set in motion by Williams’ comments. In contrast, a delay into January would likely shift the timing and path of returns without changing the broader trend. Recent market performance underscores how shifts in monetary policy expectations remain one of the most important drivers of equity market sentiment, risk appetite, and near-term momentum.
US Economy
“You have got a pretty solid labor market that is in balance. Job creation has slowed a bit in the US. At the same time, unemployment remains low. The market is in balance. As long as people get paychecks, they will spend.”
– Michael Miebach, CEO Mastercard, KBW Fintech Payments Conference (November 2025)
The longest government shutdown in history came to an end midway through the month. As a result, delayed economic data is now beginning to filter in. The most recent BLS Employment report for September continued to point to a slowing labor market, with the three-month average of jobs created at approximately +62,000 — well below the two-year average pace of +137,000. The Fed expects further softening in the months ahead, as employers remain reluctant to expand headcount but are also hesitant to resort to widespread layoffs. This caution reflects a combination of slower economic growth, persistent inflation pressures, and ongoing trade and tariff uncertainty.
Looking ahead, the outlook for the US economy will depend largely on whether this moderation in the labor market remains gradual and controlled. A balanced environment, where hiring slows but employment remains stable and unemployment stays low, should continue to support consumer spending, reinforcing the view that steady paychecks remain the foundation of economic resilience. Higher-income households, buoyed by rising asset values and home prices, are likely to remain a consistent force for demand. However, a more pronounced deterioration in job conditions would risk spreading pressure across the labor market, threatening consumer confidence and increasing the likelihood that a manageable slowdown turns into a more meaningful downturn.
Content in this material is for general information only and not intended to provide specific advice or recommendations for any individual.
The economic forecasts set forth in this material may not develop as predicted and there can be no guarantee that strategies pro- moted will be successful.
All indexes mentioned are unmanaged indexes which cannot be invested into directly. Unmanaged index returns do not reflect fees, expenses, or sales charges. Index performance is not indicative of the performance of any investment. Past performance is no guarantee of future results.
The Standard & Poor’s 500 Index is a capitalization weighted index of 500 stocks designed to measure performance of the broad domestic economy through changes in the aggregate market value of 500 stocks representing all major industries.
The S&P Midcap 400 Stock Index is an unmanaged index generally representative of the market for the stocks of mid-sized US companies.
The Russell 2000 Index is an unmanaged index generally representative of the 2,000 smallest companies in the Russell 3000 index, which represents approximately 10% of the total market capitalization of the Russell 3000 Index.
The Russell 1000 Growth Index measures the performance of those Russell 1000 companies with higher price-to-book ratios and higher forecasted growth values. Russell 1000 Value Index measures the performance of those Russell 1000 companies with lower price-to-book ratios and lower forecasted growth values.
The Russell 3000 Growth Index is an unmanaged index comprised of those Russell 3000 companies with higher price-to-book ratios and higher forecasted growth values. The Russell 3000 Value Index measures the performance of those Russell 3000 com- panies with lower price-to-book ratios and lower forecasted growth values.
The prices of small cap stocks and mid cap stocks are generally more volatile than large cap stocks. The MSCI EAFE Index is a free float-adjusted market capitalization index that is designed to measure the equity market performance of developed markets, excluding the US & Canada.
The MSCI EAFE Index consists of the following developed country indices: Australia, Austria, Belgium, Denmark, Finland, France, Germany, Hong Kong, Ireland, Israel, Italy, Japan, the Netherlands, New Zealand, Norway, Portugal, Singapore, Spain, Sweden, Switzerland and the UK.
The MSCI EM (Emerging Markets) Index is a free float-adjusted market capitalization weighted index that is designed to measure the equity market performance of the emerging market countries of the Americas, Europe, the Middle East, Africa and Asia. The MSCI EM Index consists of the following emerging market country indices: Brazil, Chile, Colombia, Mexico, Peru, Czech Republic, Egypt, Greece, Hungary, Poland, Qatar, Russia, South Africa. Turkey, United Arab Emirates, China, India, Indonesia, Korea, Malaysia, Philippines, Taiwan, and Thailand.
The MSCI US Broad Market Index captures broad US equity coverage. The index includes 3,204 constituents across large, mid, small and micro capitalizations, representing about 99% of the US equity universe.
International investing involves special risks such as currency fluctuation and political instability and may not be suitable for all investors. These risks are often heightened for investments in emerging markets.
The Barclays Capital US Corporate High Yield Bond index is an index representative of the universe of fixed-rate, non-investment grade debt.
The Bloomberg Barclays US Aggregate Bond Index is a broad-based flagship benchmark that measures the investment grade, US dollar-denominated, fixed-rate taxable bond market.
DISCLOSURES
The Bloomberg Barclays US Treasury Bills 1-3 Month Index is designed to measure the performance of public obligations of the U.S. Treasury that have a remaining maturity of greater than or equal to 1 month and less than 3 months. The Index includes all publicly issued zero coupon U.S. Treasury Bills that have a remaining maturity of less than 3 months and at least 1 month, are rated invest- ment grade, and have $300 million or more of outstanding face value.
Bonds are subject to market and interest rate risk if sold prior to maturity. Bond values will decline as interest rates rise and bonds are subject to availability and change in price.
Government bonds and Treasury bills are guaranteed by the US government as to the timely payment of principal and interest and, if held to maturity, offer a fixed rate of return and fixed principal value.
Municipal bonds are subject to availability and change in price. They are subject to market and interest rate risk if sold prior to maturity. Bond values will decline as interest rates rise. Interest income may be subject to the alternative minimum tax. Municipal bonds are federally tax-free but other state and local taxes may apply. If sold prior to maturity, capital gains tax could apply.
High yield/junk bonds (grade BB or below) are not investment grade securities, and are subject to higher interest rate, credit, and liquidity risks than those graded BBB and above. They generally should be part of a diversified portfolio for sophisticated investors.
The market value of corporate bonds will fluctuate, and if the bond is sold prior to maturity, the investor’s yield may differ from the advertised yield.
Asset allocation does not ensure a profit or protect against loss. There is no guarantee that a diversified portfolio will enhance overall returns or outperform a non-diversified portfolio.


< COMMENTARY
Market Commentary | December 02, 2025
November 2025 Market Recap
By Andrew Murphy, CFA
Co-Chief Investment Officer
November saw modest equity gains, a late-month rally driven by shifting rate expectations, and a reshaping of AI leadership. Market froth continued to cool, economic data softened, and falling Treasury yields supported fixed income—setting the stage for a disciplined outlook heading into year-end.
PRINT/DOWNLOAD
The US equity market recorded a modest +0.2% gain in November, moving into positive territory on the final trading day of the month. This marks the seventh consecutive monthly advance for the S&P 500, tied for the longest winning streak since 2021. Year-to-date, the index is up +17.8%, driven by progress on trade deals and easing tariff uncertainty, stronger-than-expected corporate earnings, sustained optimism around artificial intelligence, and the Fed’s recent rate cuts.
Short-Term Outlook: Our short-term outlook remains cautious despite some moderating signs of froth amid the first meaningful bout of market volatility since April. On the positive side, corporate earnings remain solid with continued upward revisions, and there has been selective cooling across speculative areas, helping support a more stable foundation for equities. However, the month-end rally was largely driven by shifting expectations around further rate cuts rather than improving economic momentum. Additionally, the market has only recently begun applying a more critical lens to AI — the primary driver of the bull market over the past three years — introducing greater uncertainty around the durability of recent gains. In our view, it is prudent to remain disciplined by expecting elevated volatility, staying committed to regular rebalancing toward long-term targets, and using this environment to opportunistically raise cash for upcoming distributions or future goals.
Long-Term Philosophy: We apply a Total Net Worth Approach to wealth management that integrates comprehensive financial planning with a structured investment process. Markets have historically increased over time despite frequent drawdowns as successful corporations generate profits through advances in innovation and productivity. To capitalize on the power of compounding, we believe in the benefits of staying Disciplined, Opportunistic, and Diversified, while striving to Mitigate fees, taxes, and expenses.
In our opinion, adhering to a structured process and executing on all these components should help keep our clients on track toward pursuing their long-term objectives. Historically, equity markets have recovered from recessions and downturns. Past performance is no guarantee of future returns. There is no guarantee that a diversified portfolio will enhance overall returns or outperform a non-diversified portfolio. Diversification does not protect against market risk.
All data sourced from Bloomberg as of 11/30/2025
Fixed Income Markets
Interest Rates
Interest rates fell modestly across the Treasury curve in November as concerns over a softening labor market and comments from New York Fed President John Williams reinforced expectations for another rate cut in December.
Intermediate-Term Bonds
The Bloomberg US Aggregate Bond index (Agg), which acts as a proxy for the intermediate-term investment-grade bond market, increased by +0.6% due to the decline in the 10-Year Treasury yield. Bond prices move inversely to interest rates and credit spreads. The Agg is now higher by +7.5% in 2025. Please see our Bond Primer.
After some challenging periods over the last few years, we are pleased to see solid returns from intermediate-term bonds. All else equal, we still expect intermediate-term bonds to provide both ballast and positive returns as yields either stabilize or decline. Bonds did provide ballast during the recent bout of market volatility earlier this year, gaining +1% while the equity market declined by nearly -19%. We’ll also highlight that bonds performed well in a relatively stable rate environment: since mid-October 2022, the 10-Year Treasury yield has started and ended the period at roughly 4%, while the Agg delivered an +18.7% total return (+5.6% annualized).
In our opinion, intermediate-term bonds remain an attractive investment opportunity, as the yield to maturity on the US Aggregate Bond Index ended the month at 4.3%. Yield to maturity is defined as the estimated annualized rate of return an investor can expect on a bond if purchased today and held to maturity, assuming the issuer makes all their interest and principal payments (i.e., no defaults). Bonds are subject to market and interest rate risk if sold prior to maturity. Bond values will decline as interest rates rise and bonds are subject to availability and change in price.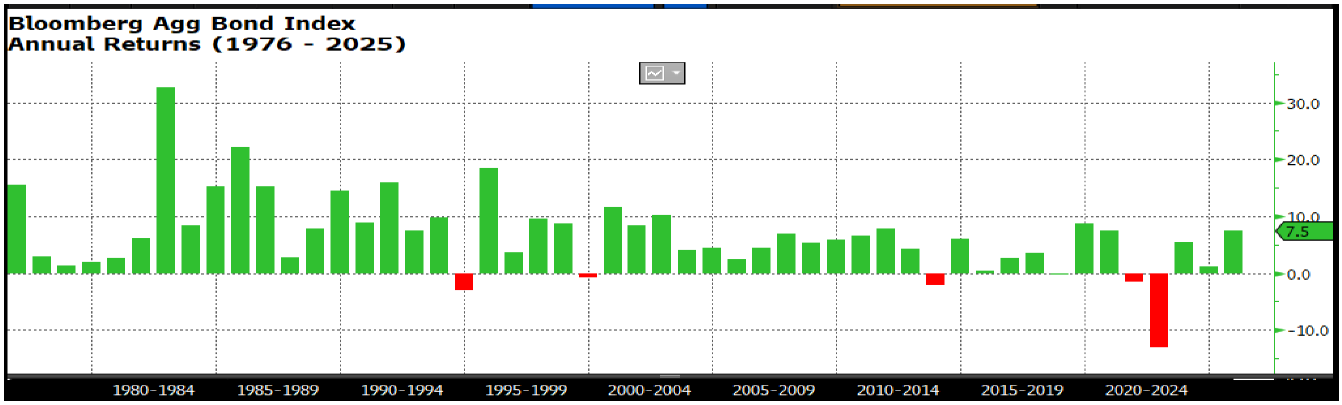 Source: Bloomberg.
Monetary Policy
As there was no Federal Open Market Committee (FOMC) meeting this month, the key Federal Reserve development came from dovish comments by New York Fed President John Williams, which triggered a sharp repricing of near-term rate expectations and a risk-on response in markets. Williams, widely viewed as the second most influential member of the committee behind Chair Powell, described monetary policy as “modestly restrictive” and suggested there is still room for a further adjustment in the near term to move policy closer to neutral. Following his remarks, the implied odds of a December rate cut surged from roughly 25% to approximately 80%, helping drive a +4.2% equity rally into month end. Upcoming FOMC meetings are scheduled for December 10th, January 28th, and March 18th.
While the timing of the next rate cut in December or January is unlikely to materially alter total equity returns over the next six months, it carries meaningful implications for short-term market dynamics. A December rate cut would meaningfully increase the probability of a traditional year-end “Santa Claus rally,” which may have already been set in motion by Williams’ comments. In contrast, a delay into January would likely shift the timing and path of returns without changing the broader trend. Recent market performance underscores how shifts in monetary policy expectations remain one of the most important drivers of equity market sentiment, risk appetite, and near-term momentum.
US Economy
The longest government shutdown in history came to an end midway through the month. As a result, delayed economic data is now beginning to filter in. The most recent BLS Employment report for September continued to point to a slowing labor market, with the three-month average of jobs created at approximately +62,000 — well below the two-year average pace of +137,000. The Fed expects further softening in the months ahead, as employers remain reluctant to expand headcount but are also hesitant to resort to widespread layoffs. This caution reflects a combination of slower economic growth, persistent inflation pressures, and ongoing trade and tariff uncertainty.
Looking ahead, the outlook for the US economy will depend largely on whether this moderation in the labor market remains gradual and controlled. A balanced environment, where hiring slows but employment remains stable and unemployment stays low, should continue to support consumer spending, reinforcing the view that steady paychecks remain the foundation of economic resilience. Higher-income households, buoyed by rising asset values and home prices, are likely to remain a consistent force for demand. However, a more pronounced deterioration in job conditions would risk spreading pressure across the labor market, threatening consumer confidence and increasing the likelihood that a manageable slowdown turns into a more meaningful downturn.
DISCLOSURES
Content in this material is for general information only and not intended to provide specific advice or recommendations for any individual.
The economic forecasts set forth in this material may not develop as predicted and there can be no guarantee that strategies pro- moted will be successful.
All indexes mentioned are unmanaged indexes which cannot be invested into directly. Unmanaged index returns do not reflect fees, expenses, or sales charges. Index performance is not indicative of the performance of any investment. Past performance is no guarantee of future results.
The Standard & Poor’s 500 Index is a capitalization weighted index of 500 stocks designed to measure performance of the broad domestic economy through changes in the aggregate market value of 500 stocks representing all major industries.
The S&P Midcap 400 Stock Index is an unmanaged index generally representative of the market for the stocks of mid-sized US companies.
The Russell 2000 Index is an unmanaged index generally representative of the 2,000 smallest companies in the Russell 3000 index, which represents approximately 10% of the total market capitalization of the Russell 3000 Index.
The Russell 1000 Growth Index measures the performance of those Russell 1000 companies with higher price-to-book ratios and higher forecasted growth values. Russell 1000 Value Index measures the performance of those Russell 1000 companies with lower price-to-book ratios and lower forecasted growth values.
The Russell 3000 Growth Index is an unmanaged index comprised of those Russell 3000 companies with higher price-to-book ratios and higher forecasted growth values. The Russell 3000 Value Index measures the performance of those Russell 3000 com- panies with lower price-to-book ratios and lower forecasted growth values.
The prices of small cap stocks and mid cap stocks are generally more volatile than large cap stocks. The MSCI EAFE Index is a free float-adjusted market capitalization index that is designed to measure the equity market performance of developed markets, excluding the US & Canada.
The MSCI EAFE Index consists of the following developed country indices: Australia, Austria, Belgium, Denmark, Finland, France, Germany, Hong Kong, Ireland, Israel, Italy, Japan, the Netherlands, New Zealand, Norway, Portugal, Singapore, Spain, Sweden, Switzerland and the UK.
The MSCI EM (Emerging Markets) Index is a free float-adjusted market capitalization weighted index that is designed to measure the equity market performance of the emerging market countries of the Americas, Europe, the Middle East, Africa and Asia. The MSCI EM Index consists of the following emerging market country indices: Brazil, Chile, Colombia, Mexico, Peru, Czech Republic, Egypt, Greece, Hungary, Poland, Qatar, Russia, South Africa. Turkey, United Arab Emirates, China, India, Indonesia, Korea, Malaysia, Philippines, Taiwan, and Thailand.
The MSCI US Broad Market Index captures broad US equity coverage. The index includes 3,204 constituents across large, mid, small and micro capitalizations, representing about 99% of the US equity universe.
International investing involves special risks such as currency fluctuation and political instability and may not be suitable for all investors. These risks are often heightened for investments in emerging markets.
The Barclays Capital US Corporate High Yield Bond index is an index representative of the universe of fixed-rate, non-investment grade debt.
The Bloomberg Barclays US Aggregate Bond Index is a broad-based flagship benchmark that measures the investment grade, US dollar-denominated, fixed-rate taxable bond market.
DISCLOSURES
The Bloomberg Barclays US Treasury Bills 1-3 Month Index is designed to measure the performance of public obligations of the U.S. Treasury that have a remaining maturity of greater than or equal to 1 month and less than 3 months. The Index includes all publicly issued zero coupon U.S. Treasury Bills that have a remaining maturity of less than 3 months and at least 1 month, are rated invest- ment grade, and have $300 million or more of outstanding face value.
Bonds are subject to market and interest rate risk if sold prior to maturity. Bond values will decline as interest rates rise and bonds are subject to availability and change in price.
Government bonds and Treasury bills are guaranteed by the US government as to the timely payment of principal and interest and, if held to maturity, offer a fixed rate of return and fixed principal value.
Municipal bonds are subject to availability and change in price. They are subject to market and interest rate risk if sold prior to maturity. Bond values will decline as interest rates rise. Interest income may be subject to the alternative minimum tax. Municipal bonds are federally tax-free but other state and local taxes may apply. If sold prior to maturity, capital gains tax could apply.
High yield/junk bonds (grade BB or below) are not investment grade securities, and are subject to higher interest rate, credit, and liquidity risks than those graded BBB and above. They generally should be part of a diversified portfolio for sophisticated investors.
The market value of corporate bonds will fluctuate, and if the bond is sold prior to maturity, the investor’s yield may differ from the advertised yield.
Asset allocation does not ensure a profit or protect against loss. There is no guarantee that a diversified portfolio will enhance overall returns or outperform a non-diversified portfolio.