» US Equity Markets: The S&P 500 decreased by -18.1% in 2022, the worst annual decline since 2008 (-37.0%). The S&P 500 is still in bear market territory (a decline of -20% on a closing basis without a subsequent +20% increase). After reaching a year-to-date low of -24.0% on October 12th when the index closed at 3,577, the S&P 500 has rebounded by +7.8% since then. The decline in the market this year was primarily due to the highest inflation levels in decades which caused the Fed to aggressively tighten monetary policy and interest rates to substantially increase. The Russia/Ukrainian War and China’s zero covid policy also helped exacerbate inflation and volatility by damaging supply chains and putting upward pressure on commodity prices.
» US Fixed Income Markets: The Bloomberg Barclays US Aggregate Bond index (Agg), which acts as a proxy for the investment-grade bond market, decreased by -13.0% in 2022, which was by far its worst calendar year on record since inception in 1976. Prior to 2022, the worst calendar year performance for the Agg was -2.9% in 1994. The negative performance was mostly caused by an increase in interest rates (bond prices move inversely to interest rates and credit spreads). Bonds did not provide ballast this year as interest rates increased, but we expect the negative correlation between stocks and bonds to return in the future once yields level out. Bonds are subject to market and interest rate risk if sold prior to maturity. Bond values will decline as interest rates rise and bonds are subject to availability and change in price.
» Treasury Yields: Treasury yields increased significantly in 2022. The 2-Year Treasury yield increased by about 369 basis points to 4.42% as investors began pricing in Fed rate hikes. The 10-Year Treasury yield increased by about 236 basis points to 3.87% as expectations of inflation continued to move higher. The Treasury yield curve is currently inverted with both the 3-Month (4.34%) and 2-Year (4.42%) higher than the 10-Year (3.87%) yield.
» Inflation: Although most readings have decelerated from peak levels over the past few months, inflation is still far too high. The Fed has divided inflation into three buckets: goods (decelerating as supply chains normalize), housing (decelerating under rising mortgage rates but not showing up in inflation data until mid-2023), and non-housing related core services (still elevated due to the strong labor market and robust average hourly earnings).
» The Fed: The FOMC raised the federal funds rate by 4.25% total in 2022, the largest net calendar year increase since 1975. The top end of the federal funds rate now stands at 4.50%. The Fed’s pivot toward aggressive rate increases and quantitative tightening has been jarring for financial markets and the economy. Inflation remains the key to markets over the near-term and we will be monitoring upcoming readings in early January to gain insight into the Fed’s future path.
» US Economy: The economy continues to slow from the post-pandemic boom due to fading stimulus, rising inflation, and Fed tightening. After increasing by +5.9% in 2021, Real GDP Growth is estimated at +1.9% in 2022 and +0.3% in 2023. Economic growth estimates have been decreasing over the past several weeks as economic indicators, manufacturing, consumer spending, and the housing market have all weakened.
» United States Recessions and S&P 500 Performance: The open debate on whether the economy has already fallen into a recession will continue for a while longer. The National Bureau of Economic Research (NBER) has stated the current period does not meet their definition of a recession. However, according to the Federal Reserve, the probability that a recession will start within the next 12-months is about 50/50. During the last 15 recessions, the S&P 500 declined by an average of -30.0%. However, once the market bottomed, performance was very strong over subsequent 1-YR (+50.1%), 3-YR (+79.0%), and 5-YR (+142.1%) periods.
» Market Outlook: 2022 was one of the most difficult investment environments since the Global Financial Crisis, and we suspect that we are not out of the woods yet. In the short-term (months), markets will likely remain volatile as investors debate whether inflation will fall fast enough to avoid a severe recession. Over the long-term (years), we still suspect this difficult economic environment has created a strong opportunity for investors willing to live with some short-term discomfort. We believe those who were able to either stay invested, rebalance, or add to their existing holdings will eventually be rewarded. Historically, equity markets have recovered from recessions and downturns; however, past performance is no guarantee of future returns. It is important to consider your own risk tolerance, financial circumstances, and time horizon.
Please see some of our most recent market commentaries:
The S&P 500 decreased by -18.1% in 2022, the worst annual decline since 2008 (-37.0%). The market did close the year with a strong Q4 (+7.6%) after three consecutive negative quarters (Q1: -4.6%, Q2: -16.1%, Q3: -4.9%). The S&P 500 is still in bear market territory (a decline of -20% on a closing basis without a subsequent +20% increase). After reaching a year-to-date low of -24.0% on October 12th when the index closed at 3,577, the S&P 500 has rebounded by +7.8% since then.
The decline in the market this year was primarily due to the highest inflation levels in decades which caused the Fed to aggressively tighten monetary policy and interest rates to substantially increase. The Russia/Ukrainian War and China’s zero covid policy also helped exacerbate inflation and volatility by damaging supply chains and putting upward pressure on commodity prices.
We constantly remind our clients to maintain a long-term viewpoint as markets can be incredibly volatile over the short-term. The stock market has historically gone up over time, but returns are not linear. Since 1928, the S&P 500 has generated a total annualized return of +9.4% despite an average peak-to-trough decline of -15% at some point each year. We will also point out that bear markets, while uncomfortable, occur about once every seven years. There have been 13 bear markets since 1928, with the S&P 500 taking about 17 months to reach a bottom and a median price drop of -34%. As noted in our S&P 500 Bear Markets chart, historically they have created strong buying opportunities. Historically, equity markets have recovered from recessions and downturns; however, past performance is no guarantee of future returns. It is important to consider your own risk tolerance, financial circumstances, and time horizon.
Source: Bloomberg
Size / Style / Sector
• Market Cap: Mid Caps (-13.1%) outperformed Large (-18.1%) and Small (-20.5%).
• Sector: Nine of eleven sectors were negative for the year. Growth sectors, including Technology, Consumer Discretionary, and Communication Services were negatively impacted by the rise in interest rates and hit the hardest. Energy stands out as the main bright spot mainly due to the rise in oil prices which caused the sector’s earnings to rise by an estimated 150%.
Source: Bloomberg
Upcoming Market Catalysts
Here are a number of market moving data points and events that we are monitoring over the next several weeks:
● 1/4: BLS Job Openings Report (JOLTS) for November
● 1/6: BLS Employment Report for December
● 1/12: BLS CPI Inflation for December
● 1/13: Q4 Earnings Season (EPS est. of -2.8%, Factset)
● 1/26: Q4 GDP Report
● 2/1: FOMC Decision
● 2/2: European Central Bank Meeting
US FIXED INCOME MARKETS
The Bloomberg Barclays US Aggregate Bond index (Agg), which acts as a proxy for the investment-grade bond market, decreased by -13.0% in 2022, which was by far its worst calendar year on record since inception in 1976. Prior to 2022, the worst calendar year performance for the Agg was -2.9% in 1994. The negative performance was mostly caused by an increase in interest rates (bond prices move inversely to interest rates and credit spreads). Similar to the equity markets, the Agg did close the year on a positive note by increasing +1.9% in Q4 after decreasing in each of the previous three quarters (Q1: -5.9%, Q2: -4.7%, Q3: -4.8%).
Our objective with fixed income is to provide ballast, stability, and income to portfolios. Ballast means that, ideally, the fixed income holdings are increasing when equity markets are declining. Bonds did not provide ballast this year as interest rates increased, but we expect the negative correlation between stocks and bonds to return in the future once yields level out. Note that all else equal the fixed income markets need yields to stabilize rather than decrease from these levels to achieve positive returns. We’ve stated this viewpoint for several months and we’ll highlight that in the fourth quarter, the 10-Year Treasury yield ended close to where it started with an increase of only 4 basis points, while the Agg increased by +1.9%. Bonds are subject to market and interest rate risk if sold prior to maturity. Bond values will decline as interest rates rise and bonds are subject to availability and change in price.
Source: Bloomberg
Source: Bloomberg
Treasury Yields
Treasury yields increased significantly in 2022. The 2-Year Treasury yield increased by about 369 basis points to 4.42% as investors began pricing in Fed rate hikes. The 10-Year Treasury yield increased by about 236 basis points to 3.87% as expectations of inflation continued to move higher. In general, the Fed controls shorter term Treasury yields by setting the target federal funds rate while the market controls long term rates as investor demand will vary based on future expectations of inflation and economic growth.
The Treasury yield curve is currently inverted with both the 3-Month (4.34%) and 2-Year (4.42%) higher than the 10-Year (3.87%) yield. An inverted yield curve is a sign of a pessimistic economic outlook and typically signals that investors expect the Fed to cut rates soon. If the Fed does cut rates as investors expect, the 3-Month and 2-Year yields will fall below the 10-Year and the yield curve will be upward sloping again. Please see our 2019 Client Question where we provide details on a Yield Curve Inversion.
Yield to Maturity
The increase in interest rates and subsequent price decline has driven the yield to maturity of various bond indices to their highest levels in years. Yield to maturity is defined as the estimated annualized rate of return an investor can expect on a bond if purchased today and held to maturity, assuming the issuer makes all their interest and principal payments (i.e., no defaults). The yield to maturity on the US Aggregate Bond index increased to 4.7% at the end of the year, which is the highest level since 2008. In other words, future returns from the Agg bond index have not been this attractive in 14 years.
Inflation Update
The increase in inflation since early-2021 was driven by supply chain bottlenecks, surging energy prices, strong consumer demand caused by a solid labor market, and massive amounts of stimulus. Although most readings have decelerated from peak levels over the past few months, inflation is still far too high. The Fed has divided inflation into three buckets: goods (decelerating as supply chains normalize), housing (decelerating under rising mortgage rates but not showing up in inflation data until mid-2023), and non-housing related core services (still elevated due to the strong labor market and robust average hourly earnings).
The Fed’s latest Summary of Economic Projections show the median participant expects Core PCE Inflation to fall to 3.5% in 2023, 2.5% in 2024, and 2.1% in 2025. Note that the Fed still shows inflation above their 2% target by the end of 2025.
We are still trying to combat the current rise in inflation by holding little cash in portfolios, avoiding long-term bonds, and overweighting equities of companies that are able to grow their cash flows, earnings, and dividends.
Here are several key inflation indicators and a chart tracking the data over the last three years:
• The Bureau of Labor Statistics Consumer Price Index (CPI) is a measure of the average change over time in the prices paid by urban consumers for a market basket of consumer goods and services. The index does include food and energy prices.
o Latest Reading: 7.1% (November). Peak: 9.1% (June).
• The Core Personal Consumption Expenditure (PCE) Index measures the prices paid by consumers for goods and services based on surveys of what businesses are selling. Core means that the index excludes food and energy prices. This is the Fed’s preferred inflation measure, which they target at an average of 2%.
o Latest Reading: 4.7% (November). Peak: 5.3% (February).
• The Core Producer Price Index (PPI) measures the average change in the selling prices received by domestic producers for their output. The prices included in the PPI are from the first commercial transaction for many products and some services.
o Latest Reading: 6.2% (November). Peak: 9.7% (March).
• The Bureau of Labor Statistics Average Hourly Earnings tracks total hourly renumeration (in cash or in kind) paid to employees in return for work done (or paid leave). Data is from the Current Employment Statistics (CES) survey.
o Latest Reading: 5.1% (November). Peak: 8.0% (April 2020).
• The University of Michigan Inflation Expectations data is based on a monthly survey designed to gauge consumer expectations. Participants are asked for their view on annual inflation over the next 5 to 10 years.
o Latest Reading: 2.9% (December). Peak: 3.1% (January).
Source: Bloomberg
THE FED
The Federal Reserve serves as the central bank of the United States and performs key functions designed to promote the health of the economy and stability of the financial system. The three key entities include the Board of Governors, twelve Federal Reserve Banks, and the Federal Open Market Committee (FOMC). The FOMC sets monetary policy in accordance with its mandate from Congress: to promote maximum employment, stable prices, and moderate long-term interest rates. According to the Fed, “monetary policy directly affects interest rates; it indirectly affects stock prices, wealth, and currency exchange rates. Through these channels, monetary policy influences spending, investment, production, employment, and inflation in the United States.” Please see our Client Question on The Fed which details the key entities, and the impact monetary policy has on the economy, interest rates, and stock prices.
Interest Rates: The FOMC raised the federal funds rate by 4.25% total in 2022, the largest net calendar year increase since 1975. The top end of the federal funds rate now stands at 4.50%. The FOMC’s most recent Summary of Economic Projections (SEP) showed that the median participant expected the federal funds rate to peak at 5.1% in 2023. The market expects the Fed will a peak rate slightly lower at 4.92% in May 2023.
Balance Sheet – Quantitative Tightening: The Fed is also reducing the size of their nearly $9 trillion balance sheet. The runoff plan is for monthly caps of about $60 billion for Treasuries and $35 billion for agency mortgage-backed securities. The monthly reduction of about $95 billion is larger than the $50 billion per month pace that was used during the 2017-2019 runoff plan. At the current runoff rate, it will take over 4 years for the Fed’s balance sheet to decrease to its pre-pandemic size.
2022 will be remembered as one of the most eventful years in Fed history, with an abrupt shift toward ultra-restrictive monetary policy to bring inflation under control. Just twelve months ago, the Fed predicted that the federal funds rate would end the year at less than 1% as transitory inflation rapidly decelerates toward their 2% target. The Fed’s pivot toward aggressive rate increases and quantitative tightening has been jarring for financial markets and the economy. The Fed’s actions are designed to remove liquidity from the financial system to decrease overall demand for goods and services. A simple definition of inflation is, “too much money chasing too few goods.” The Fed is now shrinking the amount of money available.
The Fed typically focuses on balancing maximum employment and stable prices, however, today the committee is hyper focused on bringing inflation down even if it means causing a recession. The latest FOMC minutes stated that the committee views the probability that the economy will enter a recession sometime in the next twelve months as 50/50.
With hindsight it’s clear that the Fed was wrong in their view that inflation was transitory, and the committee waited too long to tighten monetary policy. We will refrain from being overly critical of the Fed (and leave that to pundits) and focus on what matters most, which is analyzing what current and future monetary policy decisions mean for the markets, economy, and ultimately our clients. In our view, financial markets can stabilize once the Fed has confidence that inflation is decelerating, and they stop raising rates. If inflation continues its recent downward path, then the Fed might reach that conclusion early next year. If inflation readings begin to tick higher, then the Fed will keep raising rates to levels higher than presently expected, which will cause an undebatable recession and further market turmoil. Inflation remains the key to markets over the near-term and we will be monitoring upcoming readings in early January to gain insight into the Fed’s future path.
Federal Funds Rate (Upper Bound) and Fed Balance Sheet Size (Trillions) Source: Bloomberg
US ECONOMY
The economy continues to slow from the post-pandemic boom due to fading stimulus, rising inflation, and Fed tightening. The current period is best characterized by high inflation and a lot of uncertainty caused by how high the Fed will raise interest rates, the Russia/Ukraine War, and China’s covid lockdowns.
After increasing by +5.9% in 2021, Real GDP Growth is estimated at +1.9% in 2022 and +0.3% in 2023. Economic growth estimates have been decreasing over the past several weeks as economic indicators, manufacturing, consumer spending, and the housing market have all weakened. The economy can probably best be described as firing on one cylinder, the labor market. While the labor market continues to show signs of strength, we do expect the unemployment rate to tick up over the next few months as several major firms have begun to announce hiring freezes or layoffs. According to a recent PWC survey of over 700 executives, 50% of firms anticipate a reduction in headcount over the next 6 to 12 months.
The following table displays key economic data points and comparisons to recent readings and historical averages that we are watching to assess the health of the United State economy.
Source: Winthrop Wealth, Bloomberg
Source: Bloomberg
UNITED STATES RECESSIONS AND S&P 500
The National Bureau of Economic Research (NBER) Business Cycle Dating Committee is charged with maintaining official records of expansions and recessions in the United States. The NBER defines a recession as a significant decline in economic activity while an expansion is defined as a period where economic activity rises substantially. According to the NBER, since 1929 there have been 15 recessions in the US lasting an average of 13 months each.
The open debate on whether the economy has already fallen into a recession will continue for a while longer. The NBER has stated the current period does not meet their definition of a recession. However, according to the Federal Reserve, the probability that a recession will start within the next 12-months is about 50/50. In our opinion, a mild recession is likely inevitable, and it does not really matter when the official start date is. Our view is still that the potential recession would be far less severe than previous economic declines like the Global Financial Crisis of 2007 – 2009.
In finance it is commonly accepted that the stock market leads the economy by 6-12 months. The reasoning is that while they are tied together, the stock market and the economy are two different things. The key point is that the stock market is a forward-looking discounting mechanism, while most economic data is backward looking. Stock prices reflect the present value of the company’s expected future cash flows and earnings, meaning that the stock market cares more about the future than the past or present. The economic forecasts set forth in this material may not develop as predicted and past performance is no guarantee of future results.
There have been plenty of periods where the stock market is doing well while the economy is weak. In these cases, the stock market is looking ahead 6-12 months to a period of stronger economic growth and consequently more robust corporate earnings. The most recent examples occurred in 2009 (Real GDP: -2.6%, S&P 500: +26.5%) and 2020 (2nd Quarter: Real GDP: -29.9%, S&P 500: +20.5%. Full Year: Real GDP: -2.8%, S&P 500: +18.4%).
In 2022, the S&P 500 priced in an average recession when the index fell by -24.5% from January 3rd through October 12th. We are not sure if October 12th marks the ultimate bottom for this period, however, unless your view is that this is the start of another Great Depression or Financial Crisis, then a lot of the damage in the equity market may have already occurred at the recent low. Over the next few months, the stock market will begin to look forward to 2024 economic and corporate earnings growth, which currently appear a lot brighter than 2023. Time will tell, but any stock market forecast for 2023 should begin with what the economy might look like in 2024.
We will also point out that recessions can reward long-term investors and create strong near-term buying opportunities. During the last 15 recessions, the S&P 500 declined by an average of -30.0%. However, once the market bottomed, performance was very strong over subsequent 1-YR (+50.1%), 3-YR (+79.0%), and 5-YR (+142.1%) periods. Historically, equity markets have recovered from recessions and downturns. It is important to consider your risk tolerance and time horizon and let your advisor know of any changes, or liquidity needs.
Source: National Bureau of Economic Research (NBER) and Bloomberg
OUTLOOK
Our market outlook is based on four pillars: Monetary Policy, Economic Growth, Corporate Earnings, and Valuation.
ECONOMIC GROWTH
Economic growth estimates have been decreasing over the past several weeks as economic indicators, manufacturing, consumer spending, and the housing market have all weakened. While the labor market continues to show signs of strength, we do expect the unemployment rate to tick up over the next few months as several major firms have begun to announce hiring freezes or layoffs.
The open debate on whether the economy has already fallen into a recession will continue for a while longer. In our opinion, a mild recession is likely inevitable, and it does not really matter when the official start date is. Our view is still that the potential recession would be far less severe than previous economic declines like the Global Financial Crisis of 2007 – 2009.
Real GDP Estimates:
• 2022: +1.9%
• 2023: +0.3%
• 2024: +1.3%
MONETARY POLICY
The Fed has now firmly admitted that inflation is a problem and that they will tighten monetary policy to attempt to bring it under control. The Fed will tighten monetary policy and overall financial conditions by raising interest rates and shrinking the size of their balance sheet.
• Interest Rates: After raising interest rates by 0.75% at three consecutive meetings, tThe FOMC raised the federal funds rate by 4.25% total in 2022, the largest net calendar year increase since 1975. The top end of the federal funds rate now stands at 4.50%. The FOMC’s most recent Summary of Economic Projections (SEP) showed that the median participant expected the federal funds rate to peak at 5.1% in 2023.
• Balance Sheet Runoff Plan: The plan is to shrink the balance sheet by $95 billion per month ($60 billion for Treasuries and $35 billion for agency mortgage-backed securities).
Inflation remains the key to markets over the near-term. We will be monitoring upcoming readings in early January to gain insight into the Fed’s future path.
CORPORATE EARNINGS
S&P 500 earnings estimates were cut over the last several weeks as economic headwinds mount. Fourth quarter earnings season, which kicks off in mid-January, will be critically important to assess how corporations are navigating the current environment and for their outlook on future conditions.
Over long time periods, earnings drive stock prices.
VALUATION
Most valuation measures look attractive after the market decline. We will caution that if earnings estimates get lowered, the current P/E ratio is still inflated.
The P/E ratio is calculated as the current price divided by the earnings-per-share.
Valuation analysis is subjective and typically based on interest rates, earnings growth estimates, and historical or relative values.
2022 was one of the most difficult investment environments since the Global Financial Crisis, and we suspect that we are not out of the woods yet. We have separated our outlook into short- (months) and long-term (years) periods.
In the short-term (months), markets will likely remain volatile as investors debate whether inflation will fall fast enough to avoid a severe recession. If inflation either increases or stays elevated, the Fed will keep aggressively raising interest rates, likely causing an economic recession, further cuts to earnings estimates, and extended downward pressure on most asset classes. If inflation continues to moderate, the Fed can stop raising rates and investors will begin to look forward to 2024 economic and corporate earnings growth, which currently appear a lot brighter than 2023. At some point the more optimistic scenario will likely occur, although the first few months of the year might be especially rocky as we do not expect to have a definitive answer on inflation and the economy until the Spring or Summer.
Over the long-term (years), we still suspect this difficult economic environment has created a strong opportunity for investors willing to live with some short-term discomfort. The attached chart, Investing After Market Declines, utilizes S&P 500 month-end data from 1940 – 2021 and shows that investing when the index is down more than -10% from the all-time high has produced both strong average annualized returns and a high percentage of positive outcomes. We believe those who were able to either stay invested, rebalance, or add to their existing holdings will eventually be rewarded. Historically, equity markets have recovered from recessions and downturns; however, past performance is no guarantee of future returns. It is important to consider your own risk tolerance, financial circumstances, and time horizon.
We continue to rely on our time-tested process while looking for opportunities to tax loss harvest, reposition and rebalance portfolios, and selectively put money to work for clients that have recently made contributions to their accounts. On the equity side, we remain tilted toward high quality US stocks. On the fixed income side, we are taking advantage of the highest yields in over a decade while continuing to focus on achieving ballast, stability, and income as well as accounting for short-term cash needs.
At Winthrop Wealth, we follow a Total Net Worth Approach and we believe the right mindset paired with a comprehensive financial plan and a thorough investment process can provide confidence in pursuing your long-term financial goals, especially during times of heightened market volatility. We help our clients navigate challenging markets by seeking to ensure their short-term cash flow needs are met while managing the rest of their investments in a globally diversified portfolio. By having two to three years of scheduled cash flows invested in ultra-short fixed income instruments, we seek to decrease the likelihood that we will need to sell out of risk assets after a market decline to fund distributions. No strategy assures success or protects against loss.
Please see our recent Client Questions that can help put things into context:
Please see our recent Client Questions that can help put things into context:
WINTHROP WEALTH – FRAMEWORK FOR NAVIGATING CURRENT CONDITIONS
During periods of market volatility, we follow the same playbook and convey the same messages. At Winthrop Wealth, we follow a Total Net Worth Approach and we believe the right mindset paired with a comprehensive financial plan and a thorough investment process can provide confidence in working toward your long-term financial goals, especially during times of heightened market volatility.
The Right Mindset – Take a long-term viewpoint and avoid the impulse to market time
“Don’t try to buy at the bottom and sell at the top. It can’t be done – except by liars.” -Bernard Baruch
Market volatility is stressful and controlling your emotions during these periods is critical. Market timing decisions are often emotional rather than rational and data based. Making sudden large adjustments to portfolios can be value destructive over time and a major reason for poor investor performance. Please see our Client Question titled Market Timing Does Not Work, where we discuss that: the stock market has historically increased over time despite frequent drawdowns, the average investor underperforms due to market timing mistakes, and the benefit of a diversified portfolio and a long time horizon. Investors should be aware that no strategy assures success or protects against loss and market cycles may not correspond to your individual needs.
Financial Plan
“The best way to measure your investing success is not by whether you’re beating the market but by whether you’ve put in place a financial plan and behavioral discipline that are likely to get you where you want to go.” -Benjamin Graham
We believe that financial planning drives the investment strategy and provides a roadmap to each client’s unique goals and objectives. The comprehensive financial plan defines cash flow needs, seeks to optimize account structures, considers tax mitigation and estate planning strategies, and helps to evaluate financial risks as circumstances and/or goals change.
We also stress test the financial plan for many different environments including extreme volatility and market declines. The financial plan does not assume perpetually strong markets and linear returns. Rather it assumes that your portfolio will go through periods of weakness throughout your investment time horizon. We often update financial plans during and after volatility to quantify the impact the market decline had on the client’s pursuit of their long-term goals and objectives.
Investment Process
“Good times teach only bad lessons: that investing is easy, that you know its secrets, and that you needn’t worry about risk. The most valuable lessons are learned in tough times.” -Howard Marks
Our investment management process is designed to provide well-diversified portfolios constructed with a methodology based on prudent risk management, asset allocation, and security selection. We help our clients navigate challenging markets by seeking to ensure their short-term cash flow needs are met while managing the rest of their investments in a globally diversified portfolio.
Market volatility can be used to our advantage by tax-loss harvesting or reallocating to more attractive securities:
• Tax-loss Harvesting: Tax-loss harvesting is achieved by selling an investment with a loss and immediately purchasing a different security with similar (but not identical) exposure. The loss on the sold security can be used to offset taxable gains. Since we simultaneously sell a security to capture a loss and purchase a different holding with similar exposure, the client is never out of the market. We seek to capture losses during declines, and as the market recovers the new position also recovers PLUS the client has a tax-loss to offset future gains. Please see our Client Question on Tax Loss Harvesting.
• Repositioning Portfolios: Repositioning portfolios means that we can increase the overall equity allocation and/or reallocate among various asset classes. During a market selloff, portfolio equity allocations often fall below their target levels. For example, assume a portfolio is invested to its target allocation of 60% equities and then the stock market declines -10%. The new allocation would be about 54% or -6% below the target level. We can use the market decline as an opportunity to buy stocks at lower prices to bring the allocation back to the 60% target level. Furthermore, we can rotate to the equity asset classes that have become more attractive (for equities, we allocate across regions, countries, market caps, factors, styles, sectors, and industries). Keep in mind, some of the best buying opportunities have historically occurred during periods of market turmoil. Rebalancing a portfolio may cause investors to incur tax liabilities and/or transaction costs and does not assure a profit or protect against a loss.
2022 MARKET RETURNS
Source: Bloomberg
DISCLOSURES
Content in this material is for general information only and not intended to provide specific advice or recommendations for any individual.
The economic forecasts set forth in this material may not develop as predicted and there can be no guarantee that strategies promoted will be successful.
All indexes mentioned are unmanaged indexes which cannot be invested into directly. Unmanaged index returns do not reflect fees, expenses, or sales charges. Index performance is not indicative of the performance of any investment. Past performance is no guarantee of future results.
The Standard & Poor’s 500 Index is a capitalization weighted index of 500 stocks designed to measure performance of the broad domestic economy through changes in the aggregate market value of 500 stocks representing all major industries.
The S&P Midcap 400 Stock Index is an unmanaged index generally representative of the market for the stocks of mid-sized US companies.
The Russell 2000 Index is an unmanaged index generally representative of the 2,000 smallest companies in the Russell 3000 index, which represents approxi¬mately 10% of the total market capitalization of the Russell 3000 Index.
The prices of small cap stocks and mid cap stocks are generally more volatile than large cap stocks.
The MSCI EAFE Index is a free float-adjusted market capitalization index that is designed to measure the equity market performance of developed markets, excluding the US & Canada. The MSCI EAFE Index consists of the following developed country indices: Australia, Austria, Belgium, Denmark, Finland, France, Germany, Hong Kong, Ireland, Israel, Italy, Japan, the Netherlands, New Zealand, Norway, Portugal, Singapore, Spain, Sweden, Switzerland and the UK.
The MSCI EM (Emerging Markets) Index is a free float-adjusted market capitalization weighted index that is designed to measure the equity market performance of the emerging market countries of the Americas, Europe, the Middle East, Africa and Asia. The MSCI EM Index consists of the following emerging market country indices: Brazil, Chile, Colombia, Mexico, Peru, Czech Republic, Egypt, Greece, Hungary, Poland, Qatar, Russia, South Africa. Turkey, United Arab Emirates, China, India, Indonesia, Korea, Malaysia, Philippines, Taiwan, and Thailand.
International investing involves special risks such as currency fluctuation and political instability and may not be suitable for all investors. These risks are often heightened for investments in emerging markets.
The Barclays Capital US Corporate High Yield Bond index is an index representative of the universe of fixed-rate, non-investment grade debt.
The Bloomberg Barclays U.S. Aggregate Bond Index is an index of the U.S. investment-grade fixed-rate bond market, including both government and corporate bonds.
The Bloomberg Barclays US Treasury Bills 1-3 Month Index is designed to measure the performance of public obligations of the U.S. Treasury that have a remaining maturity of greater than or equal to 1 month and less than 3 months. The Index includes all publicly issued zero coupon U.S. Treasury Bills that have a remaining maturity of less than 3 months and at least 1 month, are rated investment grade, and have $300 million or more of outstanding face value.
Bonds are subject to market and interest rate risk if sold prior to maturity. Bond values will decline as interest rates rise and bonds are subject to availability and change in price.
The Bloomberg Commodity Total Return index is composed of futures contracts and reflects the returns on a fully collateralized investment in the BCOM. This combines the returns of the BCOM with the returns on cash collateral invested in 13 week (3 Month) U.S. Treasury Bills.
Government bonds and Treasury bills are guaranteed by the US government as to the timely payment of principal and interest and, if held to maturity, offer a fixed rate of return and fixed principal value.
Financial planning is a tool intended to review your current financial situation, investment objectives and goals, and suggest potential planning ideas and concepts that may be of benefit. There is no guarantee that financial planning will help you reach your goals.
Rebalancing a portfolio may cause you to incur tax liabilities and/or transaction costs and does not assure a profit or protect against a loss.
Asset allocation does not ensure a profit or protect against loss. There is no guarantee that a diversified portfolio will enhance overall returns or outperform a non-diversified portfolio.
Diversification does not protect against market risk. All investing involves risk which you should be prepared to bear.
Securities offered through LPL Financial, Member FINRA/SIPC. Investment Advice offered through Winthrop Wealth, a Registered Investment Advisor and separate entity from LPL Financial.


< COMMENTARY
Market Commentary | January 05, 2023
2022 Market Review and Outlook
By Andrew Murphy, CFA
Co-Chief Investment Officer
2022 HIGHLIGHTS
» US Equity Markets: The S&P 500 decreased by -18.1% in 2022, the worst annual decline since 2008 (-37.0%). The S&P 500 is still in bear market territory (a decline of -20% on a closing basis without a subsequent +20% increase). After reaching a year-to-date low of -24.0% on October 12th when the index closed at 3,577, the S&P 500 has rebounded by +7.8% since then. The decline in the market this year was primarily due to the highest inflation levels in decades which caused the Fed to aggressively tighten monetary policy and interest rates to substantially increase. The Russia/Ukrainian War and China’s zero covid policy also helped exacerbate inflation and volatility by damaging supply chains and putting upward pressure on commodity prices.
» US Fixed Income Markets: The Bloomberg Barclays US Aggregate Bond index (Agg), which acts as a proxy for the investment-grade bond market, decreased by -13.0% in 2022, which was by far its worst calendar year on record since inception in 1976. Prior to 2022, the worst calendar year performance for the Agg was -2.9% in 1994. The negative performance was mostly caused by an increase in interest rates (bond prices move inversely to interest rates and credit spreads). Bonds did not provide ballast this year as interest rates increased, but we expect the negative correlation between stocks and bonds to return in the future once yields level out. Bonds are subject to market and interest rate risk if sold prior to maturity. Bond values will decline as interest rates rise and bonds are subject to availability and change in price.
» Treasury Yields: Treasury yields increased significantly in 2022. The 2-Year Treasury yield increased by about 369 basis points to 4.42% as investors began pricing in Fed rate hikes. The 10-Year Treasury yield increased by about 236 basis points to 3.87% as expectations of inflation continued to move higher. The Treasury yield curve is currently inverted with both the 3-Month (4.34%) and 2-Year (4.42%) higher than the 10-Year (3.87%) yield.
» Inflation: Although most readings have decelerated from peak levels over the past few months, inflation is still far too high. The Fed has divided inflation into three buckets: goods (decelerating as supply chains normalize), housing (decelerating under rising mortgage rates but not showing up in inflation data until mid-2023), and non-housing related core services (still elevated due to the strong labor market and robust average hourly earnings).
» The Fed: The FOMC raised the federal funds rate by 4.25% total in 2022, the largest net calendar year increase since 1975. The top end of the federal funds rate now stands at 4.50%. The Fed’s pivot toward aggressive rate increases and quantitative tightening has been jarring for financial markets and the economy. Inflation remains the key to markets over the near-term and we will be monitoring upcoming readings in early January to gain insight into the Fed’s future path.
» US Economy: The economy continues to slow from the post-pandemic boom due to fading stimulus, rising inflation, and Fed tightening. After increasing by +5.9% in 2021, Real GDP Growth is estimated at +1.9% in 2022 and +0.3% in 2023. Economic growth estimates have been decreasing over the past several weeks as economic indicators, manufacturing, consumer spending, and the housing market have all weakened.
» United States Recessions and S&P 500 Performance: The open debate on whether the economy has already fallen into a recession will continue for a while longer. The National Bureau of Economic Research (NBER) has stated the current period does not meet their definition of a recession. However, according to the Federal Reserve, the probability that a recession will start within the next 12-months is about 50/50. During the last 15 recessions, the S&P 500 declined by an average of -30.0%. However, once the market bottomed, performance was very strong over subsequent 1-YR (+50.1%), 3-YR (+79.0%), and 5-YR (+142.1%) periods.
» Market Outlook: 2022 was one of the most difficult investment environments since the Global Financial Crisis, and we suspect that we are not out of the woods yet. In the short-term (months), markets will likely remain volatile as investors debate whether inflation will fall fast enough to avoid a severe recession. Over the long-term (years), we still suspect this difficult economic environment has created a strong opportunity for investors willing to live with some short-term discomfort. We believe those who were able to either stay invested, rebalance, or add to their existing holdings will eventually be rewarded. Historically, equity markets have recovered from recessions and downturns; however, past performance is no guarantee of future returns. It is important to consider your own risk tolerance, financial circumstances, and time horizon.
Please see some of our most recent market commentaries:
US EQUITY MARKETS
The S&P 500 decreased by -18.1% in 2022, the worst annual decline since 2008 (-37.0%). The market did close the year with a strong Q4 (+7.6%) after three consecutive negative quarters (Q1: -4.6%, Q2: -16.1%, Q3: -4.9%). The S&P 500 is still in bear market territory (a decline of -20% on a closing basis without a subsequent +20% increase). After reaching a year-to-date low of -24.0% on October 12th when the index closed at 3,577, the S&P 500 has rebounded by +7.8% since then.
The decline in the market this year was primarily due to the highest inflation levels in decades which caused the Fed to aggressively tighten monetary policy and interest rates to substantially increase. The Russia/Ukrainian War and China’s zero covid policy also helped exacerbate inflation and volatility by damaging supply chains and putting upward pressure on commodity prices.
We constantly remind our clients to maintain a long-term viewpoint as markets can be incredibly volatile over the short-term. The stock market has historically gone up over time, but returns are not linear. Since 1928, the S&P 500 has generated a total annualized return of +9.4% despite an average peak-to-trough decline of -15% at some point each year. We will also point out that bear markets, while uncomfortable, occur about once every seven years. There have been 13 bear markets since 1928, with the S&P 500 taking about 17 months to reach a bottom and a median price drop of -34%. As noted in our S&P 500 Bear Markets chart, historically they have created strong buying opportunities. Historically, equity markets have recovered from recessions and downturns; however, past performance is no guarantee of future returns. It is important to consider your own risk tolerance, financial circumstances, and time horizon.
Size / Style / Sector
• Market Cap: Mid Caps (-13.1%) outperformed Large (-18.1%) and Small (-20.5%).
• Style: Value (Russell 1000 Value: -7.6%) exceeded Growth (Russell 1000 Growth: -29.1%).
• Sector: Nine of eleven sectors were negative for the year. Growth sectors, including Technology, Consumer Discretionary, and Communication Services were negatively impacted by the rise in interest rates and hit the hardest. Energy stands out as the main bright spot mainly due to the rise in oil prices which caused the sector’s earnings to rise by an estimated 150%.
Upcoming Market Catalysts
Here are a number of market moving data points and events that we are monitoring over the next several weeks:
● 1/4: BLS Job Openings Report (JOLTS) for November
● 1/6: BLS Employment Report for December
● 1/12: BLS CPI Inflation for December
● 1/13: Q4 Earnings Season (EPS est. of -2.8%, Factset)
● 1/26: Q4 GDP Report
● 2/1: FOMC Decision
● 2/2: European Central Bank Meeting
US FIXED INCOME MARKETS
The Bloomberg Barclays US Aggregate Bond index (Agg), which acts as a proxy for the investment-grade bond market, decreased by -13.0% in 2022, which was by far its worst calendar year on record since inception in 1976. Prior to 2022, the worst calendar year performance for the Agg was -2.9% in 1994. The negative performance was mostly caused by an increase in interest rates (bond prices move inversely to interest rates and credit spreads). Similar to the equity markets, the Agg did close the year on a positive note by increasing +1.9% in Q4 after decreasing in each of the previous three quarters (Q1: -5.9%, Q2: -4.7%, Q3: -4.8%).
Our objective with fixed income is to provide ballast, stability, and income to portfolios. Ballast means that, ideally, the fixed income holdings are increasing when equity markets are declining. Bonds did not provide ballast this year as interest rates increased, but we expect the negative correlation between stocks and bonds to return in the future once yields level out. Note that all else equal the fixed income markets need yields to stabilize rather than decrease from these levels to achieve positive returns. We’ve stated this viewpoint for several months and we’ll highlight that in the fourth quarter, the 10-Year Treasury yield ended close to where it started with an increase of only 4 basis points, while the Agg increased by +1.9%. Bonds are subject to market and interest rate risk if sold prior to maturity. Bond values will decline as interest rates rise and bonds are subject to availability and change in price.
Source: Bloomberg
Treasury Yields
Treasury yields increased significantly in 2022. The 2-Year Treasury yield increased by about 369 basis points to 4.42% as investors began pricing in Fed rate hikes. The 10-Year Treasury yield increased by about 236 basis points to 3.87% as expectations of inflation continued to move higher. In general, the Fed controls shorter term Treasury yields by setting the target federal funds rate while the market controls long term rates as investor demand will vary based on future expectations of inflation and economic growth.
The Treasury yield curve is currently inverted with both the 3-Month (4.34%) and 2-Year (4.42%) higher than the 10-Year (3.87%) yield. An inverted yield curve is a sign of a pessimistic economic outlook and typically signals that investors expect the Fed to cut rates soon. If the Fed does cut rates as investors expect, the 3-Month and 2-Year yields will fall below the 10-Year and the yield curve will be upward sloping again. Please see our 2019 Client Question where we provide details on a Yield Curve Inversion.
Yield to Maturity
The increase in interest rates and subsequent price decline has driven the yield to maturity of various bond indices to their highest levels in years. Yield to maturity is defined as the estimated annualized rate of return an investor can expect on a bond if purchased today and held to maturity, assuming the issuer makes all their interest and principal payments (i.e., no defaults). The yield to maturity on the US Aggregate Bond index increased to 4.7% at the end of the year, which is the highest level since 2008. In other words, future returns from the Agg bond index have not been this attractive in 14 years.
Inflation Update
The increase in inflation since early-2021 was driven by supply chain bottlenecks, surging energy prices, strong consumer demand caused by a solid labor market, and massive amounts of stimulus. Although most readings have decelerated from peak levels over the past few months, inflation is still far too high. The Fed has divided inflation into three buckets: goods (decelerating as supply chains normalize), housing (decelerating under rising mortgage rates but not showing up in inflation data until mid-2023), and non-housing related core services (still elevated due to the strong labor market and robust average hourly earnings).
The Fed’s latest Summary of Economic Projections show the median participant expects Core PCE Inflation to fall to 3.5% in 2023, 2.5% in 2024, and 2.1% in 2025. Note that the Fed still shows inflation above their 2% target by the end of 2025.
We are still trying to combat the current rise in inflation by holding little cash in portfolios, avoiding long-term bonds, and overweighting equities of companies that are able to grow their cash flows, earnings, and dividends.
Here are several key inflation indicators and a chart tracking the data over the last three years:
• The Bureau of Labor Statistics Consumer Price Index (CPI) is a measure of the average change over time in the prices paid by urban consumers for a market basket of consumer goods and services. The index does include food and energy prices.
o Latest Reading: 7.1% (November). Peak: 9.1% (June).
• The Core Personal Consumption Expenditure (PCE) Index measures the prices paid by consumers for goods and services based on surveys of what businesses are selling. Core means that the index excludes food and energy prices. This is the Fed’s preferred inflation measure, which they target at an average of 2%.
o Latest Reading: 4.7% (November). Peak: 5.3% (February).
• The Core Producer Price Index (PPI) measures the average change in the selling prices received by domestic producers for their output. The prices included in the PPI are from the first commercial transaction for many products and some services.
o Latest Reading: 6.2% (November). Peak: 9.7% (March).
• The Bureau of Labor Statistics Average Hourly Earnings tracks total hourly renumeration (in cash or in kind) paid to employees in return for work done (or paid leave). Data is from the Current Employment Statistics (CES) survey.
o Latest Reading: 5.1% (November). Peak: 8.0% (April 2020).
• The University of Michigan Inflation Expectations data is based on a monthly survey designed to gauge consumer expectations. Participants are asked for their view on annual inflation over the next 5 to 10 years.
o Latest Reading: 2.9% (December). Peak: 3.1% (January).
THE FED
The Federal Reserve serves as the central bank of the United States and performs key functions designed to promote the health of the economy and stability of the financial system. The three key entities include the Board of Governors, twelve Federal Reserve Banks, and the Federal Open Market Committee (FOMC). The FOMC sets monetary policy in accordance with its mandate from Congress: to promote maximum employment, stable prices, and moderate long-term interest rates. According to the Fed, “monetary policy directly affects interest rates; it indirectly affects stock prices, wealth, and currency exchange rates. Through these channels, monetary policy influences spending, investment, production, employment, and inflation in the United States.” Please see our Client Question on The Fed which details the key entities, and the impact monetary policy has on the economy, interest rates, and stock prices.
Interest Rates: The FOMC raised the federal funds rate by 4.25% total in 2022, the largest net calendar year increase since 1975. The top end of the federal funds rate now stands at 4.50%. The FOMC’s most recent Summary of Economic Projections (SEP) showed that the median participant expected the federal funds rate to peak at 5.1% in 2023. The market expects the Fed will a peak rate slightly lower at 4.92% in May 2023.
Balance Sheet – Quantitative Tightening: The Fed is also reducing the size of their nearly $9 trillion balance sheet. The runoff plan is for monthly caps of about $60 billion for Treasuries and $35 billion for agency mortgage-backed securities. The monthly reduction of about $95 billion is larger than the $50 billion per month pace that was used during the 2017-2019 runoff plan. At the current runoff rate, it will take over 4 years for the Fed’s balance sheet to decrease to its pre-pandemic size.
2022 will be remembered as one of the most eventful years in Fed history, with an abrupt shift toward ultra-restrictive monetary policy to bring inflation under control. Just twelve months ago, the Fed predicted that the federal funds rate would end the year at less than 1% as transitory inflation rapidly decelerates toward their 2% target. The Fed’s pivot toward aggressive rate increases and quantitative tightening has been jarring for financial markets and the economy. The Fed’s actions are designed to remove liquidity from the financial system to decrease overall demand for goods and services. A simple definition of inflation is, “too much money chasing too few goods.” The Fed is now shrinking the amount of money available.
The Fed typically focuses on balancing maximum employment and stable prices, however, today the committee is hyper focused on bringing inflation down even if it means causing a recession. The latest FOMC minutes stated that the committee views the probability that the economy will enter a recession sometime in the next twelve months as 50/50.
With hindsight it’s clear that the Fed was wrong in their view that inflation was transitory, and the committee waited too long to tighten monetary policy. We will refrain from being overly critical of the Fed (and leave that to pundits) and focus on what matters most, which is analyzing what current and future monetary policy decisions mean for the markets, economy, and ultimately our clients. In our view, financial markets can stabilize once the Fed has confidence that inflation is decelerating, and they stop raising rates. If inflation continues its recent downward path, then the Fed might reach that conclusion early next year. If inflation readings begin to tick higher, then the Fed will keep raising rates to levels higher than presently expected, which will cause an undebatable recession and further market turmoil. Inflation remains the key to markets over the near-term and we will be monitoring upcoming readings in early January to gain insight into the Fed’s future path.
Federal Funds Rate (Upper Bound) and Fed Balance Sheet Size (Trillions)
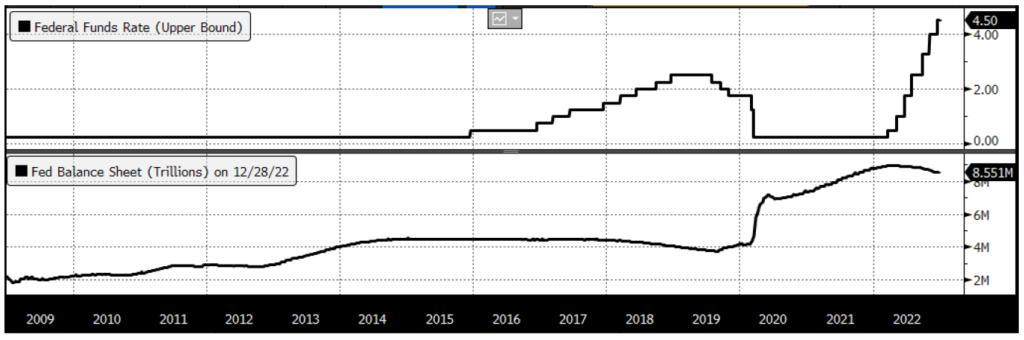 Source: Bloomberg
US ECONOMY
The economy continues to slow from the post-pandemic boom due to fading stimulus, rising inflation, and Fed tightening. The current period is best characterized by high inflation and a lot of uncertainty caused by how high the Fed will raise interest rates, the Russia/Ukraine War, and China’s covid lockdowns.
After increasing by +5.9% in 2021, Real GDP Growth is estimated at +1.9% in 2022 and +0.3% in 2023. Economic growth estimates have been decreasing over the past several weeks as economic indicators, manufacturing, consumer spending, and the housing market have all weakened. The economy can probably best be described as firing on one cylinder, the labor market. While the labor market continues to show signs of strength, we do expect the unemployment rate to tick up over the next few months as several major firms have begun to announce hiring freezes or layoffs. According to a recent PWC survey of over 700 executives, 50% of firms anticipate a reduction in headcount over the next 6 to 12 months.
The following table displays key economic data points and comparisons to recent readings and historical averages that we are watching to assess the health of the United State economy.
UNITED STATES RECESSIONS AND S&P 500
The National Bureau of Economic Research (NBER) Business Cycle Dating Committee is charged with maintaining official records of expansions and recessions in the United States. The NBER defines a recession as a significant decline in economic activity while an expansion is defined as a period where economic activity rises substantially. According to the NBER, since 1929 there have been 15 recessions in the US lasting an average of 13 months each.
The open debate on whether the economy has already fallen into a recession will continue for a while longer. The NBER has stated the current period does not meet their definition of a recession. However, according to the Federal Reserve, the probability that a recession will start within the next 12-months is about 50/50. In our opinion, a mild recession is likely inevitable, and it does not really matter when the official start date is. Our view is still that the potential recession would be far less severe than previous economic declines like the Global Financial Crisis of 2007 – 2009.
In finance it is commonly accepted that the stock market leads the economy by 6-12 months. The reasoning is that while they are tied together, the stock market and the economy are two different things. The key point is that the stock market is a forward-looking discounting mechanism, while most economic data is backward looking. Stock prices reflect the present value of the company’s expected future cash flows and earnings, meaning that the stock market cares more about the future than the past or present. The economic forecasts set forth in this material may not develop as predicted and past performance is no guarantee of future results.
There have been plenty of periods where the stock market is doing well while the economy is weak. In these cases, the stock market is looking ahead 6-12 months to a period of stronger economic growth and consequently more robust corporate earnings. The most recent examples occurred in 2009 (Real GDP: -2.6%, S&P 500: +26.5%) and 2020 (2nd Quarter: Real GDP: -29.9%, S&P 500: +20.5%. Full Year: Real GDP: -2.8%, S&P 500: +18.4%).
In 2022, the S&P 500 priced in an average recession when the index fell by -24.5% from January 3rd through October 12th. We are not sure if October 12th marks the ultimate bottom for this period, however, unless your view is that this is the start of another Great Depression or Financial Crisis, then a lot of the damage in the equity market may have already occurred at the recent low. Over the next few months, the stock market will begin to look forward to 2024 economic and corporate earnings growth, which currently appear a lot brighter than 2023. Time will tell, but any stock market forecast for 2023 should begin with what the economy might look like in 2024.
We will also point out that recessions can reward long-term investors and create strong near-term buying opportunities. During the last 15 recessions, the S&P 500 declined by an average of -30.0%. However, once the market bottomed, performance was very strong over subsequent 1-YR (+50.1%), 3-YR (+79.0%), and 5-YR (+142.1%) periods. Historically, equity markets have recovered from recessions and downturns. It is important to consider your risk tolerance and time horizon and let your advisor know of any changes, or liquidity needs.
Source: National Bureau of Economic Research (NBER) and Bloomberg
OUTLOOK
Our market outlook is based on four pillars: Monetary Policy, Economic Growth, Corporate Earnings, and Valuation.
ECONOMIC GROWTH
Economic growth estimates have been decreasing over the past several weeks as economic indicators, manufacturing, consumer spending, and the housing market have all weakened. While the labor market continues to show signs of strength, we do expect the unemployment rate to tick up over the next few months as several major firms have begun to announce hiring freezes or layoffs.
The open debate on whether the economy has already fallen into a recession will continue for a while longer. In our opinion, a mild recession is likely inevitable, and it does not really matter when the official start date is. Our view is still that the potential recession would be far less severe than previous economic declines like the Global Financial Crisis of 2007 – 2009.
Real GDP Estimates:
• 2022: +1.9%
• 2023: +0.3%
• 2024: +1.3%
MONETARY POLICY
The Fed has now firmly admitted that inflation is a problem and that they will tighten monetary policy to attempt to bring it under control. The Fed will tighten monetary policy and overall financial conditions by raising interest rates and shrinking the size of their balance sheet.
• Interest Rates: After raising interest rates by 0.75% at three consecutive meetings, tThe FOMC raised the federal funds rate by 4.25% total in 2022, the largest net calendar year increase since 1975. The top end of the federal funds rate now stands at 4.50%. The FOMC’s most recent Summary of Economic Projections (SEP) showed that the median participant expected the federal funds rate to peak at 5.1% in 2023.
• Balance Sheet Runoff Plan: The plan is to shrink the balance sheet by $95 billion per month ($60 billion for Treasuries and $35 billion for agency mortgage-backed securities).
Inflation remains the key to markets over the near-term. We will be monitoring upcoming readings in early January to gain insight into the Fed’s future path.
CORPORATE EARNINGS
S&P 500 earnings estimates were cut over the last several weeks as economic headwinds mount. Fourth quarter earnings season, which kicks off in mid-January, will be critically important to assess how corporations are navigating the current environment and for their outlook on future conditions.
S&P 500 Earnings Estimates
• 2022: $224 (+8%)
• 2023: $242 (+8%)
• 2024: $263 (+9%)
Over long time periods, earnings drive stock prices.
VALUATION
Most valuation measures look attractive after the market decline. We will caution that if earnings estimates get lowered, the current P/E ratio is still inflated.
The P/E ratio is calculated as the current price divided by the earnings-per-share.
• Forward P/E (next 12-months): 15.2x.
• 25-Year Average: 16.8x.
Valuation analysis is subjective and typically based on interest rates, earnings growth estimates, and historical or relative values.
2022 was one of the most difficult investment environments since the Global Financial Crisis, and we suspect that we are not out of the woods yet. We have separated our outlook into short- (months) and long-term (years) periods.
In the short-term (months), markets will likely remain volatile as investors debate whether inflation will fall fast enough to avoid a severe recession. If inflation either increases or stays elevated, the Fed will keep aggressively raising interest rates, likely causing an economic recession, further cuts to earnings estimates, and extended downward pressure on most asset classes. If inflation continues to moderate, the Fed can stop raising rates and investors will begin to look forward to 2024 economic and corporate earnings growth, which currently appear a lot brighter than 2023. At some point the more optimistic scenario will likely occur, although the first few months of the year might be especially rocky as we do not expect to have a definitive answer on inflation and the economy until the Spring or Summer.
Over the long-term (years), we still suspect this difficult economic environment has created a strong opportunity for investors willing to live with some short-term discomfort. The attached chart, Investing After Market Declines, utilizes S&P 500 month-end data from 1940 – 2021 and shows that investing when the index is down more than -10% from the all-time high has produced both strong average annualized returns and a high percentage of positive outcomes. We believe those who were able to either stay invested, rebalance, or add to their existing holdings will eventually be rewarded. Historically, equity markets have recovered from recessions and downturns; however, past performance is no guarantee of future returns. It is important to consider your own risk tolerance, financial circumstances, and time horizon.
We continue to rely on our time-tested process while looking for opportunities to tax loss harvest, reposition and rebalance portfolios, and selectively put money to work for clients that have recently made contributions to their accounts. On the equity side, we remain tilted toward high quality US stocks. On the fixed income side, we are taking advantage of the highest yields in over a decade while continuing to focus on achieving ballast, stability, and income as well as accounting for short-term cash needs.
At Winthrop Wealth, we follow a Total Net Worth Approach and we believe the right mindset paired with a comprehensive financial plan and a thorough investment process can provide confidence in pursuing your long-term financial goals, especially during times of heightened market volatility. We help our clients navigate challenging markets by seeking to ensure their short-term cash flow needs are met while managing the rest of their investments in a globally diversified portfolio. By having two to three years of scheduled cash flows invested in ultra-short fixed income instruments, we seek to decrease the likelihood that we will need to sell out of risk assets after a market decline to fund distributions. No strategy assures success or protects against loss.
Please see our recent Client Questions that can help put things into context:
Please see our recent Client Questions that can help put things into context:
WINTHROP WEALTH – FRAMEWORK FOR NAVIGATING CURRENT CONDITIONS
During periods of market volatility, we follow the same playbook and convey the same messages. At Winthrop Wealth, we follow a Total Net Worth Approach and we believe the right mindset paired with a comprehensive financial plan and a thorough investment process can provide confidence in working toward your long-term financial goals, especially during times of heightened market volatility.
The Right Mindset – Take a long-term viewpoint and avoid the impulse to market time
Market volatility is stressful and controlling your emotions during these periods is critical. Market timing decisions are often emotional rather than rational and data based. Making sudden large adjustments to portfolios can be value destructive over time and a major reason for poor investor performance. Please see our Client Question titled Market Timing Does Not Work, where we discuss that: the stock market has historically increased over time despite frequent drawdowns, the average investor underperforms due to market timing mistakes, and the benefit of a diversified portfolio and a long time horizon. Investors should be aware that no strategy assures success or protects against loss and market cycles may not correspond to your individual needs.
Financial Plan
We believe that financial planning drives the investment strategy and provides a roadmap to each client’s unique goals and objectives. The comprehensive financial plan defines cash flow needs, seeks to optimize account structures, considers tax mitigation and estate planning strategies, and helps to evaluate financial risks as circumstances and/or goals change.
We also stress test the financial plan for many different environments including extreme volatility and market declines. The financial plan does not assume perpetually strong markets and linear returns. Rather it assumes that your portfolio will go through periods of weakness throughout your investment time horizon. We often update financial plans during and after volatility to quantify the impact the market decline had on the client’s pursuit of their long-term goals and objectives.
Investment Process
Our investment management process is designed to provide well-diversified portfolios constructed with a methodology based on prudent risk management, asset allocation, and security selection. We help our clients navigate challenging markets by seeking to ensure their short-term cash flow needs are met while managing the rest of their investments in a globally diversified portfolio.
Market volatility can be used to our advantage by tax-loss harvesting or reallocating to more attractive securities:
• Tax-loss Harvesting: Tax-loss harvesting is achieved by selling an investment with a loss and immediately purchasing a different security with similar (but not identical) exposure. The loss on the sold security can be used to offset taxable gains. Since we simultaneously sell a security to capture a loss and purchase a different holding with similar exposure, the client is never out of the market. We seek to capture losses during declines, and as the market recovers the new position also recovers PLUS the client has a tax-loss to offset future gains. Please see our Client Question on Tax Loss Harvesting.
• Repositioning Portfolios: Repositioning portfolios means that we can increase the overall equity allocation and/or reallocate among various asset classes. During a market selloff, portfolio equity allocations often fall below their target levels. For example, assume a portfolio is invested to its target allocation of 60% equities and then the stock market declines -10%. The new allocation would be about 54% or -6% below the target level. We can use the market decline as an opportunity to buy stocks at lower prices to bring the allocation back to the 60% target level. Furthermore, we can rotate to the equity asset classes that have become more attractive (for equities, we allocate across regions, countries, market caps, factors, styles, sectors, and industries). Keep in mind, some of the best buying opportunities have historically occurred during periods of market turmoil. Rebalancing a portfolio may cause investors to incur tax liabilities and/or transaction costs and does not assure a profit or protect against a loss.
2022 MARKET RETURNS
DISCLOSURES
Content in this material is for general information only and not intended to provide specific advice or recommendations for any individual.
The economic forecasts set forth in this material may not develop as predicted and there can be no guarantee that strategies promoted will be successful.
All indexes mentioned are unmanaged indexes which cannot be invested into directly. Unmanaged index returns do not reflect fees, expenses, or sales charges. Index performance is not indicative of the performance of any investment. Past performance is no guarantee of future results.
The Standard & Poor’s 500 Index is a capitalization weighted index of 500 stocks designed to measure performance of the broad domestic economy through changes in the aggregate market value of 500 stocks representing all major industries.
The S&P Midcap 400 Stock Index is an unmanaged index generally representative of the market for the stocks of mid-sized US companies.
The Russell 2000 Index is an unmanaged index generally representative of the 2,000 smallest companies in the Russell 3000 index, which represents approxi¬mately 10% of the total market capitalization of the Russell 3000 Index.
The prices of small cap stocks and mid cap stocks are generally more volatile than large cap stocks.
The MSCI EAFE Index is a free float-adjusted market capitalization index that is designed to measure the equity market performance of developed markets, excluding the US & Canada. The MSCI EAFE Index consists of the following developed country indices: Australia, Austria, Belgium, Denmark, Finland, France, Germany, Hong Kong, Ireland, Israel, Italy, Japan, the Netherlands, New Zealand, Norway, Portugal, Singapore, Spain, Sweden, Switzerland and the UK.
The MSCI EM (Emerging Markets) Index is a free float-adjusted market capitalization weighted index that is designed to measure the equity market performance of the emerging market countries of the Americas, Europe, the Middle East, Africa and Asia. The MSCI EM Index consists of the following emerging market country indices: Brazil, Chile, Colombia, Mexico, Peru, Czech Republic, Egypt, Greece, Hungary, Poland, Qatar, Russia, South Africa. Turkey, United Arab Emirates, China, India, Indonesia, Korea, Malaysia, Philippines, Taiwan, and Thailand.
International investing involves special risks such as currency fluctuation and political instability and may not be suitable for all investors. These risks are often heightened for investments in emerging markets.
The Barclays Capital US Corporate High Yield Bond index is an index representative of the universe of fixed-rate, non-investment grade debt.
The Bloomberg Barclays U.S. Aggregate Bond Index is an index of the U.S. investment-grade fixed-rate bond market, including both government and corporate bonds.
The Bloomberg Barclays US Treasury Bills 1-3 Month Index is designed to measure the performance of public obligations of the U.S. Treasury that have a remaining maturity of greater than or equal to 1 month and less than 3 months. The Index includes all publicly issued zero coupon U.S. Treasury Bills that have a remaining maturity of less than 3 months and at least 1 month, are rated investment grade, and have $300 million or more of outstanding face value.
Bonds are subject to market and interest rate risk if sold prior to maturity. Bond values will decline as interest rates rise and bonds are subject to availability and change in price.
The Bloomberg Commodity Total Return index is composed of futures contracts and reflects the returns on a fully collateralized investment in the BCOM. This combines the returns of the BCOM with the returns on cash collateral invested in 13 week (3 Month) U.S. Treasury Bills.
Government bonds and Treasury bills are guaranteed by the US government as to the timely payment of principal and interest and, if held to maturity, offer a fixed rate of return and fixed principal value.
Financial planning is a tool intended to review your current financial situation, investment objectives and goals, and suggest potential planning ideas and concepts that may be of benefit. There is no guarantee that financial planning will help you reach your goals.
Rebalancing a portfolio may cause you to incur tax liabilities and/or transaction costs and does not assure a profit or protect against a loss.
Asset allocation does not ensure a profit or protect against loss. There is no guarantee that a diversified portfolio will enhance overall returns or outperform a non-diversified portfolio.
Diversification does not protect against market risk. All investing involves risk which you should be prepared to bear.
Securities offered through LPL Financial, Member FINRA/SIPC. Investment Advice offered through Winthrop Wealth, a Registered Investment Advisor and separate entity from LPL Financial.