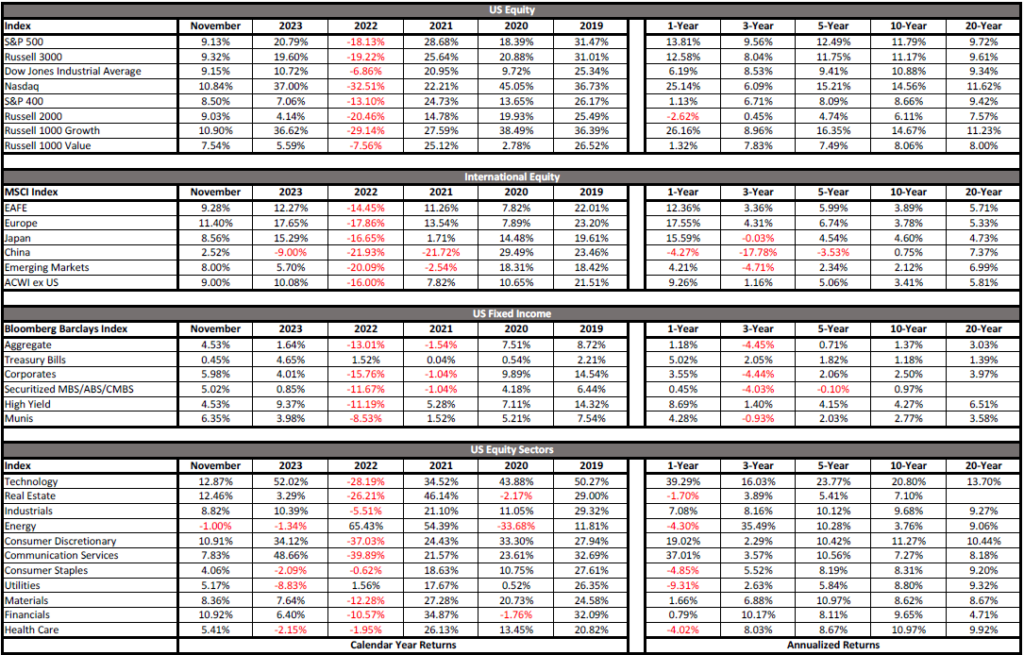
The Santa Claus rally started early this year as the S&P 500 increased by 9.1% in November, bringing the year-to-date total to +20.8%. The main cause for the rally in the month was further evidence that inflation is cooling and a decline in interest rates from multi-decade highs. The summer hangover, where the S&P 500 experienced-10% correction from 7/31/23 to 10/27/23, didn’t last very long. On a total return basis, the S&P 500 is now about -2% below its all-time high reached on January 3rd, 2022, and about +30% above the 2022 closing low on October 12th. Events over the last several weeks are another example of why we constantly remind our clients to maintain a long-term viewpoint as markets can be incredibly volatile over short periods. Nervous investors who made emotional changes to their portfolio during the recent correction may have missed out on the subsequent rally.
Market Cap: Large (S&P 500: +9.1%) outperformed Mid (S&P 400: 8.5%) and Small Caps (Russell 2000: +9.0%).
Sector: Ten out of eleven sectors were positive in the month with Technology (+12.9%) and Real Estate (+12.5%) as the top performers and Energy (-1.0%) as the laggard.
The market rally over the last year was driven by evidence of disinflation, the economy, labor market, and corporate earnings holding up better than expected, and the perceived benefit that artificial intelligence (AI) will have on profits and productivity.
Outlook
Short-Term: We’ve changed our short-term outlook several times this year in response to evolving market conditions. Our investment style tends to be contrarian in the short term and optimistic over the long term. Over short periods, we often turn cautious when the market gets greedy and extended, and positive when the market declines and investors begin to panic. Markets do not move in straight lines, so we attempt to take advantage of volatility by zigging when the market is zagging. We aim to express our views through tweaks to many of our actively managed portfolios. We will generally trim equities or get more defensive when we view the market as extended and add to equities during selloffs. We believe this approach helps our clients navigate volatile markets through a comprehensive and repeatable process.
Last month, as the market was amid a correction, we wrote that we have upgraded our near-term view to balanced from cautious. We certainly didn’t forecast a +9.1% increase in November, or we would have been more upbeat. Going forward, we think returning our near-term view to cautious makes sense after the recent rally. In our opinion, the fundamentals of the stock market do not warrant a recovery back to all-time highs yet. Valuations are stretched above long-term historical averages. While earnings and economic growth estimates look strong for 2024, both will face potential downside if the economy stumbles. As always, we stand ready to adjust our view and actively managed portfolios as the environment progresses. The economic forecasts set forth in this material may not develop as predicted and there can be no guarantee that strategies promoted will be successful.
Long-term: In our view, investors with a globally diversified portfolio and a long-term time horizon should continue to remain optimistic. Markets have historically increased over time despite frequent drawdowns as successful corporations have been able to figure out ways to generate profits through advances in innovation and productivity. To capitalize on the power of compounding, we believe in the benefits of staying Disciplined, Opportunistic, and Diversified, while striving to Mitigate fees, taxes, and expenses.
Disciplined: consistently applying our investment process and philosophy, which are grounded in a long-term approach.
Opportunistic: rebalancing, repositioning, and tax-loss harvesting to take advantage of market volatility and dislocations.
Diversified: seeking to ensure that portfolios are properly allocated across and among asset classes to enhance consistency.
Mitigate: striving to avoid unnecessary disbursements, including fees, taxes, and expenses.
In our opinion, adhering to a structured process and executing on all these components should help keep our clients on track toward pursuing their long-term objectives. Historically, equity markets have recovered from recessions and downturns. Past performance is no guarantee of future returns. There is no guarantee that a diversified portfolio will enhance overall returns or outperform a non-diversified portfolio. Diversification does not protect against market risk.
Fixed Income Market
Interest Rates Yields declined from multi-year highs as continued evidence of disinflation led the market to believe that the Fed would abandon their “higher-for-longer” outlook and begin to cut interest rates in mid-2024. The 2-Year Treasury fell from 5.09% to 4.68% and the 10-Year declined from 4.93% to 4.33% during the month. The 10-Year Treasury yield dropped after reaching a peak of 5.02% on October 23rd, which was the first move above 5% since July 2007. The decline in yields created a boost for the fixed income markets as bond prices move inversely to interest rates and credit spreads. Several reasons for interest rates have moved higher over the past several years remain, including the country’s debt and deficit problem.
Short-Term Bonds Short-term bonds have closer maturities and are consequently less interest rate sensitive than intermediate- or long-term fixed income securities. Pursuing stability and income from short-term bonds, including Treasuries, has been a successful strategy as yields remain elevated. Short-term Treasury yields, including, the 3-Month (5.4%), 6-Month (5.4%), and 12-Month (5.1%) are still at their highest levels since the early 2000s. Once the Fed starts cutting the federal funds rate, short-term Treasury yields should also decline. We don’t expect +5% short-term yields to be around forever, but we are opportunistically enjoying them while they last. If interested, please speak with your advisor about our Cash Alternatives Strategy, which is an investment strategy designed for individuals or entities to invest excess cash seeking potentially attractive yields in a conservative portfolio of short-term fixed income securities, including US Treasuries. Bonds are subject to market and interest rate risk if sold prior to maturity. Bond values will decline as interest rates rise and bonds are subject to availability and change in price. Investing involves risk including loss of principal. This strategy and its related holdings are not FDIC-insured.
Intermediate-Term Bonds The Bloomberg US Aggregate Bond index (Agg), which acts as a proxy for the intermediate-term investment-grade bond market, increased by +4.5% in November as the 10-Year Treasury yield declined to 4.33% in the period (bond prices move inversely to interest rates and credit spreads). The monthly increase put the bond market back into positive territory for the year. The Agg is now higher by +1.6% in 2023.
We hold intermediate-term fixed income in diversified portfolios to pursue ballast and income. The last two-plus years have been frustrating for intermediate-term fixed income investors as bonds have provided negative returns without any ballast. Since September 1, 2021, the Agg bond index has decreased by about -12% as the 10-Year Treasury yield has increased by about 300 basis points (3%).
We continue to recommend a patient approach, as all else equal, we expect intermediate-term bonds to provide both ballast and positive returns in the future once yields at least stabilize. November was a prime example of patience paying off with strong returns as interest rates declined. Furthermore, we continue to see opportunity as the yield to maturity on the US Aggregate Bond index ended the month at 5.1%, which is still close to the highest level since 2008. Yield to maturity is defined as the estimated annualized rate of return an investor can expect on a bond if purchased today and held to maturity, assuming the issuer makes all their interest and principal payments (i.e., no defaults). In our view, patient investors should be optimistic about intermediate-term fixed income returns over the next several years. Bonds are subject to market and interest rate risk if sold prior to maturity. Bond values will decline as interest rates rise and bonds are subject to availability and change in price.
Monetary Policy
“The Committee is proceeding carefully. We will make decisions about the extent of additional policy firming and how long policy will remain restrictive based on the totality of the incoming data, the evolving outlook, and the balance of risks.” – Fed Chair Jerome Powell
At their November 1st meeting, the Federal Open Market Committee (FOMC) left the top end of the federal funds rate unchanged at 5.50%. Since March of 2022, the Fed has increased interest rates by 5.25% total for one of the quickest tightening cycles in United States history.
While the Fed still believes that inflation is too high, they feel they are making progress in the fight to bring it down. The Fed estimates that real interest rates are now in restrictive territory and are putting downward pressure on economic growth and inflation. Chair Powell reiterated that the FOMC will be data dependent and proceed carefully regarding any future rate increases.
The Fed is likely done raising interest rates, barring an unexpected resurgence in inflation. The Fed’s focus will now shift from how high to raise interest rates to concentrating on how long they should keep rates elevated. The market is currently pricing in about 100 basis points (1%) of rate cuts in 2024 with the first 0.25% decrease occurring in May. The Fed will publish a new Summary of Economic Projections (SEP) at their December 13th meeting. We will see if the Fed’s outlook aligns with current market pricing.
We suspect that the Fed will hold off on cutting interest rates until either of the following scenarios occur:
The Fed declares victory over inflation. The latest measure of the Fed’s preferred reading, Core PCE Inflation, came in at +3.5% in October, which is still above the Fed’s 2.0% target. The reading likely needs to approach 3% to give the Fed enough confidence that inflation is on a sustained downward trajectory to their 2.0% target. In this scenario, the Fed would cut interest rates so that monetary policy isn’t too restrictive.
Something breaks in the economy, which causes the Fed to believe that GDP will slow, and that unemployment will rise. We’ve seen the Fed quickly respond to economic shocks by cutting interest rates and turning to accommodative monetary policy.
Please see our Client Question on The Fed, which details the key entities and the impact monetary policy has on the economy, interest rates, and stock prices.
US Economy
To the surprise of many economists and prognosticators, there will not be an economic recession in 2023. Real GDP growth for 2023 is estimated at +2.4%, compared with a forecast of +0.3% at the start of the year. The economy and consumer are still being supported by a strong labor market and excess savings built up since the pandemic. Early indications of holiday shopping indicate that consumers spent at a healthy pace over Black Friday and Cyber Monday.
While we have been pleased with how the economy has performed, there are still reasons for caution. Several recessionary indicators are still flashing yellow or red, including the inverted yield curve, leading economic indicators, and the ISM Manufacturing survey. There is also some evidence that the consumer may be running low on purchasing power. Furthermore, the lagged effect of tighter monetary policy and the resumption of student loan payments will all weigh on near-term economic activity.
We’re taking a wait-and-see approach as the post-pandemic economy has thrown a series of head fakes. At times a recession seemed imminent and at other times we watched as the labor market set new records. Most forecasters who have been consistently calling for a recession have simply moved their predicated start date to 2024.
We continue to believe that the key to economic growth going forward is for inflation to become contained so the Fed can stop their tightening cycle before higher interest rates eventually lead to cracks in the labor market and/or the broader economy. Inflation has made significant progress, and the Fed is probably several months away from lowering rates, but we are not quite out of the woods yet.
November 2023 Market Returns
DISCLOSURES
All data sourced from Bloomberg as of 11/30/2023
Content in this material is for general information only and not intended to provide specific advice or recommendations for any individual.
The economic forecasts set forth in this material may not develop as predicted and there can be no guarantee that strategies promoted will be successful.
All indexes mentioned are unmanaged indexes which cannot be invested into directly. Unmanaged index returns do not reflect fees, expenses, or sales charges. Index performance is not indicative of the performance of any investment. Past performance is no guarantee of future results.
The Standard & Poor’s 500 Index is a capitalization weighted index of 500 stocks designed to measure performance of the broad domestic economy through changes in the aggregate market value of 500 stocks representing all major industries.
The S&P Midcap 400 Stock Index is an unmanaged index generally representative of the market for the stocks of mid-sized US companies.
The Russell 2000 Index is an unmanaged index generally representative of the 2,000 smallest companies in the Russell 3000 index, which represents approximately 10% of the total market capitalization of the Russell 3000 Index.
The Russell 1000 Growth Index measures the performance of those Russell 1000 companies with higher price-to-book ratios and higher forecasted growth values. Russell 1000 Value Index measures the performance of those Russell 1000 companies with lower price-to-book ratios and lower forecasted growth values.
The Russell 3000 Growth Index is an unmanaged index comprised of those Russell 3000 companies with higher price-to-book ratios and higher forecasted growth values. The Russell 3000 Value Index measures the performance of those Russell 3000 companies with lower price-to-book ratios and lower forecasted growth values.
The prices of small cap stocks and mid cap stocks are generally more volatile than large cap stocks. The MSCI EAFE Index is a free float-adjusted market capitalization index that is designed to measure the equity market performance of developed markets, excluding the US & Canada. The MSCI EAFE Index consists of the following developed country indices: Australia, Austria, Belgium, Denmark, Finland, France, Germany, Hong Kong, Ireland, Israel, Italy, Japan, the Netherlands, New Zealand, Norway, Portugal, Singapore, Spain, Sweden, Switzerland and the UK.
The MSCI EM (Emerging Markets) Index is a free float-adjusted market capitalization weighted index that is designed to measure the equity market performance of the emerging market countries of the Americas, Europe, the Middle East, Africa and Asia. The MSCI EM Index consists of the following emerging market country indices: Brazil, Chile, Colombia, Mexico, Peru, Czech Republic, Egypt, Greece,
Hungary, Poland, Qatar, Russia, South Africa. Turkey, United Arab Emirates, China, India, Indonesia, Korea, Malaysia, Philippines, Taiwan, and Thailand.
The MSCI US Broad Market Index captures broad US equity coverage. The index includes 3,204 constituents across large, mid, small and micro capitalizations, representing about 99% of the US equity universe.
International investing involves special risks such as currency fluctuation and political instability and may not be suitable for all investors. These risks are often heightened for investments in emerging markets.
The Barclays Capital US Corporate High Yield Bond index is an index representative of the universe of fixed-rate, non-investment grade debt.
The Bloomberg Barclays U.S. Aggregate Bond Index is an index of the U.S. investment-grade fixed-rate bond market, including both government and corporate bonds.
The Bloomberg Barclays US Treasury Bills 1-3 Month Index is designed to measure the performance of public obligations of the U.S.
Treasury that have a remaining maturity of greater than or equal to 1 month and less than 3 months. The Index includes all publicly issued zero coupon U.S. Treasury Bills that have a remaining maturity of less than 3 months and at least 1 month, are rated investment grade, and have $300 million or more of outstanding face value.
Bonds are subject to market and interest rate risk if sold prior to maturity. Bond values will decline as interest rates rise and bonds are subject to availability and change in price.
Government bonds and Treasury bills are guaranteed by the US government as to the timely payment of principal and interest and, if held to maturity, offer a fixed rate of return and fixed principal value.
Municipal bonds are subject to availability and change in price. They are subject to market and interest rate risk if sold prior to maturity. Bond values will decline as interest rates rise. Interest income may be subject to the alternative minimum tax. Municipal bonds are federally tax-free but other state and local taxes may apply. If sold prior to maturity, capital gains tax could apply.
High yield/junk bonds (grade BB or below) are not investment grade securities, and are subject to higher interest rate, credit, and liquidity risks than those graded BBB and above. They generally should be part of a diversified portfolio for sophisticated investors.
The market value of corporate bonds will fluctuate, and if the bond is sold prior to maturity, the investor’s yield may differ from the advertised yield.
Financial planning is a tool intended to review your current financial situation, investment objectives and goals, and suggest potential planning ideas and concepts that may be of benefit. There is no guarantee that financial planning will help you reach your goals.
Asset allocation does not ensure a profit or protect against loss. There is no guarantee that a diversified portfolio will enhance overall returns or outperform a non-diversified portfolio.
Diversification does not protect against market risk. All investing involves risk which you should be prepared to bear.
Securities offered through LPL Financial, Member FINRA/SIPC. Investment Advice offered through Winthrop Wealth, a Registered Investment Advisor and separate entity from LPL Financial.


< COMMENTARY
Market Commentary | December 05, 2023
November 2023 Market Recap
By Andrew Murphy, CFA
Co-Chief Investment Officer
The Santa Claus rally started early this year as the S&P 500 increased by 9.1% in November, bringing the year-to-date total to +20.8%. The main cause for the rally in the month was further evidence that inflation is cooling and a decline in interest rates from multi-decade highs. The summer hangover, where the S&P 500 experienced-10% correction from 7/31/23 to 10/27/23, didn’t last very long. On a total return basis, the S&P 500 is now about -2% below its all-time high reached on January 3rd, 2022, and about +30% above the 2022 closing low on October 12th. Events over the last several weeks are another example of why we constantly remind our clients to maintain a long-term viewpoint as markets can be incredibly volatile over short periods. Nervous investors who made emotional changes to their portfolio during the recent correction may have missed out on the subsequent rally.
The market rally over the last year was driven by evidence of disinflation, the economy, labor market, and corporate earnings holding up better than expected, and the perceived benefit that artificial intelligence (AI) will have on profits and productivity.
Outlook
Short-Term: We’ve changed our short-term outlook several times this year in response to evolving market conditions. Our investment style tends to be contrarian in the short term and optimistic over the long term. Over short periods, we often turn cautious when the market gets greedy and extended, and positive when the market declines and investors begin to panic. Markets do not move in straight lines, so we attempt to take advantage of volatility by zigging when the market is zagging. We aim to express our views through tweaks to many of our actively managed portfolios. We will generally trim equities or get more defensive when we view the market as extended and add to equities during selloffs. We believe this approach helps our clients navigate volatile markets through a comprehensive and repeatable process.
Last month, as the market was amid a correction, we wrote that we have upgraded our near-term view to balanced from cautious. We certainly didn’t forecast a +9.1% increase in November, or we would have been more upbeat. Going forward, we think returning our near-term view to cautious makes sense after the recent rally. In our opinion, the fundamentals of the stock market do not warrant a recovery back to all-time highs yet. Valuations are stretched above long-term historical averages. While earnings and economic growth estimates look strong for 2024, both will face potential downside if the economy stumbles. As always, we stand ready to adjust our view and actively managed portfolios as the environment progresses. The economic forecasts set forth in this material may not develop as predicted and there can be no guarantee that strategies promoted will be successful.
Long-term: In our view, investors with a globally diversified portfolio and a long-term time horizon should continue to remain optimistic. Markets have historically increased over time despite frequent drawdowns as successful corporations have been able to figure out ways to generate profits through advances in innovation and productivity. To capitalize on the power of compounding, we believe in the benefits of staying Disciplined, Opportunistic, and Diversified, while striving to Mitigate fees, taxes, and expenses.
In our opinion, adhering to a structured process and executing on all these components should help keep our clients on track toward pursuing their long-term objectives. Historically, equity markets have recovered from recessions and downturns. Past performance is no guarantee of future returns. There is no guarantee that a diversified portfolio will enhance overall returns or outperform a non-diversified portfolio. Diversification does not protect against market risk.
Fixed Income Market
Interest Rates
Yields declined from multi-year highs as continued evidence of disinflation led the market to believe that the Fed would abandon their “higher-for-longer” outlook and begin to cut interest rates in mid-2024. The 2-Year Treasury fell from 5.09% to 4.68% and the 10-Year declined from 4.93% to 4.33% during the month. The 10-Year Treasury yield dropped after reaching a peak of 5.02% on October 23rd, which was the first move above 5% since July 2007. The decline in yields created a boost for the fixed income markets as bond prices move inversely to interest rates and credit spreads. Several reasons for interest rates have moved higher over the past several years remain, including the country’s debt and deficit problem.
Short-Term Bonds
Short-term bonds have closer maturities and are consequently less interest rate sensitive than intermediate- or long-term fixed income securities. Pursuing stability and income from short-term bonds, including Treasuries, has been a successful strategy as yields remain elevated. Short-term Treasury yields, including, the 3-Month (5.4%), 6-Month (5.4%), and 12-Month (5.1%) are still at their highest levels since the early 2000s. Once the Fed starts cutting the federal funds rate, short-term Treasury yields should also decline. We don’t expect +5% short-term yields to be around forever, but we are opportunistically enjoying them while they last. If interested, please speak with your advisor about our Cash Alternatives Strategy, which is an investment strategy designed for individuals or entities to invest excess cash seeking potentially attractive yields in a conservative portfolio of short-term fixed income securities, including US Treasuries. Bonds are subject to market and interest rate risk if sold prior to maturity. Bond values will decline as interest rates rise and bonds are subject to availability and change in price. Investing involves risk including loss of principal. This strategy and its related holdings are not FDIC-insured.
Intermediate-Term Bonds
The Bloomberg US Aggregate Bond index (Agg), which acts as a proxy for the intermediate-term investment-grade bond market, increased by +4.5% in November as the 10-Year Treasury yield declined to 4.33% in the period (bond prices move inversely to interest rates and credit spreads). The monthly increase put the bond market back into positive territory for the year. The Agg is now higher by +1.6% in 2023.
We hold intermediate-term fixed income in diversified portfolios to pursue ballast and income. The last two-plus years have been frustrating for intermediate-term fixed income investors as bonds have provided negative returns without any ballast. Since September 1, 2021, the Agg bond index has decreased by about -12% as the 10-Year Treasury yield has increased by about 300 basis points (3%).
We continue to recommend a patient approach, as all else equal, we expect intermediate-term bonds to provide both ballast and positive returns in the future once yields at least stabilize. November was a prime example of patience paying off with strong returns as interest rates declined. Furthermore, we continue to see opportunity as the yield to maturity on the US Aggregate Bond index ended the month at 5.1%, which is still close to the highest level since 2008. Yield to maturity is defined as the estimated annualized rate of return an investor can expect on a bond if purchased today and held to maturity, assuming the issuer makes all their interest and principal payments (i.e., no defaults). In our view, patient investors should be optimistic about intermediate-term fixed income returns over the next several years. Bonds are subject to market and interest rate risk if sold prior to maturity. Bond values will decline as interest rates rise and bonds are subject to availability and change in price.
Monetary Policy
At their November 1st meeting, the Federal Open Market Committee (FOMC) left the top end of the federal funds rate unchanged at 5.50%. Since March of 2022, the Fed has increased interest rates by 5.25% total for one of the quickest tightening cycles in United States history.
While the Fed still believes that inflation is too high, they feel they are making progress in the fight to bring it down. The Fed estimates that real interest rates are now in restrictive territory and are putting downward pressure on economic growth and inflation. Chair Powell reiterated that the FOMC will be data dependent and proceed carefully regarding any future rate increases.
The Fed is likely done raising interest rates, barring an unexpected resurgence in inflation. The Fed’s focus will now shift from how high to raise interest rates to concentrating on how long they should keep rates elevated. The market is currently pricing in about 100 basis points (1%) of rate cuts in 2024 with the first 0.25% decrease occurring in May. The Fed will publish a new Summary of Economic Projections (SEP) at their December 13th meeting. We will see if the Fed’s outlook aligns with current market pricing.
We suspect that the Fed will hold off on cutting interest rates until either of the following scenarios occur:
Please see our Client Question on The Fed, which details the key entities and the impact monetary policy has on the economy, interest rates, and stock prices.
US Economy
To the surprise of many economists and prognosticators, there will not be an economic recession in 2023. Real GDP growth for 2023 is estimated at +2.4%, compared with a forecast of +0.3% at the start of the year. The economy and consumer are still being supported by a strong labor market and excess savings built up since the pandemic. Early indications of holiday shopping indicate that consumers spent at a healthy pace over Black Friday and Cyber Monday.
While we have been pleased with how the economy has performed, there are still reasons for caution. Several recessionary indicators are still flashing yellow or red, including the inverted yield curve, leading economic indicators, and the ISM Manufacturing survey. There is also some evidence that the consumer may be running low on purchasing power. Furthermore, the lagged effect of tighter monetary policy and the resumption of student loan payments will all weigh on near-term economic activity.
We’re taking a wait-and-see approach as the post-pandemic economy has thrown a series of head fakes. At times a recession seemed imminent and at other times we watched as the labor market set new records. Most forecasters who have been consistently calling for a recession have simply moved their predicated start date to 2024.
We continue to believe that the key to economic growth going forward is for inflation to become contained so the Fed can stop their tightening cycle before higher interest rates eventually lead to cracks in the labor market and/or the broader economy. Inflation has made significant progress, and the Fed is probably several months away from lowering rates, but we are not quite out of the woods yet.
November 2023 Market Returns
DISCLOSURES
All data sourced from Bloomberg as of 11/30/2023
Content in this material is for general information only and not intended to provide specific advice or recommendations for any individual.
The economic forecasts set forth in this material may not develop as predicted and there can be no guarantee that strategies promoted will be successful.
All indexes mentioned are unmanaged indexes which cannot be invested into directly. Unmanaged index returns do not reflect fees, expenses, or sales charges. Index performance is not indicative of the performance of any investment. Past performance is no guarantee of future results.
The Standard & Poor’s 500 Index is a capitalization weighted index of 500 stocks designed to measure performance of the broad domestic economy through changes in the aggregate market value of 500 stocks representing all major industries.
The S&P Midcap 400 Stock Index is an unmanaged index generally representative of the market for the stocks of mid-sized US companies.
The Russell 2000 Index is an unmanaged index generally representative of the 2,000 smallest companies in the Russell 3000 index, which represents approximately 10% of the total market capitalization of the Russell 3000 Index.
The Russell 1000 Growth Index measures the performance of those Russell 1000 companies with higher price-to-book ratios and higher forecasted growth values. Russell 1000 Value Index measures the performance of those Russell 1000 companies with lower price-to-book ratios and lower forecasted growth values.
The Russell 3000 Growth Index is an unmanaged index comprised of those Russell 3000 companies with higher price-to-book ratios and higher forecasted growth values. The Russell 3000 Value Index measures the performance of those Russell 3000 companies with lower price-to-book ratios and lower forecasted growth values.
The prices of small cap stocks and mid cap stocks are generally more volatile than large cap stocks. The MSCI EAFE Index is a free float-adjusted market capitalization index that is designed to measure the equity market performance of developed markets, excluding the US & Canada. The MSCI EAFE Index consists of the following developed country indices: Australia, Austria, Belgium, Denmark, Finland, France, Germany, Hong Kong, Ireland, Israel, Italy, Japan, the Netherlands, New Zealand, Norway, Portugal, Singapore, Spain, Sweden, Switzerland and the UK.
The MSCI EM (Emerging Markets) Index is a free float-adjusted market capitalization weighted index that is designed to measure the equity market performance of the emerging market countries of the Americas, Europe, the Middle East, Africa and Asia. The MSCI EM Index consists of the following emerging market country indices: Brazil, Chile, Colombia, Mexico, Peru, Czech Republic, Egypt, Greece,
Hungary, Poland, Qatar, Russia, South Africa. Turkey, United Arab Emirates, China, India, Indonesia, Korea, Malaysia, Philippines, Taiwan, and Thailand.
The MSCI US Broad Market Index captures broad US equity coverage. The index includes 3,204 constituents across large, mid, small and micro capitalizations, representing about 99% of the US equity universe.
International investing involves special risks such as currency fluctuation and political instability and may not be suitable for all investors. These risks are often heightened for investments in emerging markets.
The Barclays Capital US Corporate High Yield Bond index is an index representative of the universe of fixed-rate, non-investment grade debt.
The Bloomberg Barclays U.S. Aggregate Bond Index is an index of the U.S. investment-grade fixed-rate bond market, including both government and corporate bonds.
The Bloomberg Barclays US Treasury Bills 1-3 Month Index is designed to measure the performance of public obligations of the U.S.
Treasury that have a remaining maturity of greater than or equal to 1 month and less than 3 months. The Index includes all publicly issued zero coupon U.S. Treasury Bills that have a remaining maturity of less than 3 months and at least 1 month, are rated investment grade, and have $300 million or more of outstanding face value.
Bonds are subject to market and interest rate risk if sold prior to maturity. Bond values will decline as interest rates rise and bonds are subject to availability and change in price.
Government bonds and Treasury bills are guaranteed by the US government as to the timely payment of principal and interest and, if held to maturity, offer a fixed rate of return and fixed principal value.
Municipal bonds are subject to availability and change in price. They are subject to market and interest rate risk if sold prior to maturity. Bond values will decline as interest rates rise. Interest income may be subject to the alternative minimum tax. Municipal bonds are federally tax-free but other state and local taxes may apply. If sold prior to maturity, capital gains tax could apply.
High yield/junk bonds (grade BB or below) are not investment grade securities, and are subject to higher interest rate, credit, and liquidity risks than those graded BBB and above. They generally should be part of a diversified portfolio for sophisticated investors.
The market value of corporate bonds will fluctuate, and if the bond is sold prior to maturity, the investor’s yield may differ from the advertised yield.
Financial planning is a tool intended to review your current financial situation, investment objectives and goals, and suggest potential planning ideas and concepts that may be of benefit. There is no guarantee that financial planning will help you reach your goals.
Asset allocation does not ensure a profit or protect against loss. There is no guarantee that a diversified portfolio will enhance overall returns or outperform a non-diversified portfolio.
Diversification does not protect against market risk. All investing involves risk which you should be prepared to bear.
Securities offered through LPL Financial, Member FINRA/SIPC. Investment Advice offered through Winthrop Wealth, a Registered Investment Advisor and separate entity from LPL Financial.