» US Equity Markets: The equity market rally continued to roll in the second quarter as the S&P 500 increased by +4.3%. The market has gained in six of the last seven quarters. Year-to-date, the S&P is up by +15.3%. The market return was driven by moderation in several inflation indicators and spectacular earnings from several of the largest companies in the world. Market returns were broad based over the last several months, but that trend reversed starting in May with two of the largest stocks in the index, Apple (+23%) and Nvidia (+37%) doing most of the heavy lifting. Cumulatively, these two stocks accounted for nearly 75% of the S&P 500’s quarterly return with Nvidia responsible for about 44%.
» Treasury Yields: Yields increased across most of the Treasury yield curve after rising in April and then pulling back as several inflation indicators began to moderate. The 2-Year Treasury increased by 13 basis points (bps) and the 10-Year rose by 20bps.
» US Fixed Income Market: The Bloomberg US Aggregate Bond index (Agg), which acts as a proxy for the intermediate-term investment-grade bond market, gained +0.1% despite the increase in the 10-Year Treasury yield. The year-to-date return of the Agg is now -0.7%. Intermediate-term bonds are still an attractive investment opportunity in our opinion as the yield to maturity on the Agg index ended the quarter at 5.0%.
» Inflation: Most inflation readings have decelerated from peak levels with several indicators returning to normalized ranges. Given that, the Fed is likely getting ready to declare victory over inflation by lowering interest rates at some point over the next few months.
» The Fed: The top end of the federal funds rate has remained at 5.50% since July 2023. The FOMC has been on pause since raising rates by 5.25% total over a seventeen-month period beginning in March 2022. As the Fed gains more confidence that inflation is on a sustainable downward trajectory, they will begin to lower interest rates. The FOMC’s most recent Summary of Economic Projections (SEP) showed that the median participant expects they will lower rates to 5.1% in 2024 and to 4.1% in 2025.
» US Economy: The US Economy continues to grow at a solid pace, supported by a strong labor market and consumer spending. We have seen a slowdown in recent data, but it is too early to say that cracks are forming. Real GDP growth is estimated at +2.3% in 2024 and +1.8% in 2025.
» Short-Term Market Outlook: Our short-term outlook has been cautious since the market began to run toward all-time highs late last year. For the stock market to maintain its positive momentum, we will need economic, inflation, and earnings data to continue exceeding already high expectations. Thus far, economic data has been fine. Inflation started the year hotter than expected but has recently begun to moderate. Earnings have been strong, especially from AI related companies. Right now, we see the biggest risks to the market as a reacceleration in inflation or anything the challenges the earnings growth of the AI leaders, especially Nvidia. Moving forward, we know that market declines are common, and we believe that a pause or pullback to shake out some of the excesses built up over the past several months would be healthy for long-term performance. No strategy assures success or protects against loss.
» Long-term Investment Philosophy: Although our short-term outlook changes based on current conditions, our long-term outlook remains optimistic for investors with both a comprehensive financial plan and investment process. Markets have historically increased over time despite frequent drawdowns as successful corporations have been able to figure out ways to generate profits through advances in innovation and productivity. To capitalize on the power of compounding, we believe in the benefits of staying Disciplined, Opportunistic, and Diversified, while striving to Mitigate fees, taxes, and expenses. In our opinion, adhering to a structured process and executing on all these components should help keep our clients on track toward pursuing their long-term objectives. Historically, equity markets have recovered from recessions and downturns. Past performance is no guarantee of future returns. There is no guarantee that a diversified portfolio will enhance overall returns or outperform a non-diversified portfolio. Diversification does not protect against market risk.
US Equity Markets
The equity market rally continued to roll in the second quarter as the S&P 500 increased by +4.3%. The market has gained in six of the last seven quarters. Year-to-date, the S&P is up by +15.3%. The market return was driven by moderation in several inflation indicators and spectacular earnings from several of the largest companies in the world.
Performance over the last several years reinforces our belief in a long-term viewpoint as markets can be incredibly volatile over the short term. Please see our Client Question: Principles for Long-TermInvesting.
» New All-Time High: The S&P 500 reached a new all-time closing high of 5,487 on June 18th.
» Bull Market Alive and Well: The market is up by nearly +57% since the start of the latest bull market on 10/12/22. The market rally over that time was driven by evidence of disinflation, the economy, labor market, and corporate earnings all exceeding expectations, the Fed thinking about cutting rates, and the impact of artificial intelligence (AI) will have on profits and productivity.
» Nvidia Goes Parabolic: Nvidia, the global leader in graphics processing units (GPUs) for use in artificial intelligence (AI) applications, has had a spectacular run as the stock has gained over +975% since mid-October 2022. During the quarter, Nvidia briefly became the largest publicly traded company in the world and ended the period with a market cap above $3 trillion. The stock gained +37% in the second quarter and has now increased by about +150% year-to-date.
» Leadership Narrows: Market returns were broad based over the last several months, but that trend reversed starting in May with two of the largest stocks in the index, Apple (+23%) and Nvidia (+37%) doing most of the heavy lifting. Cumulatively, these two stocks accounted for nearly 75% of the S&P 500’s quarterly return with Nvidia responsible for about 44%.
» Mega Caps or Nothing (For Now): Asset classes (Large Cap, Growth, Technology, and Communication Services) that contain the Mega Cap Growth stocks like Apple, Nvidia, Microsoft, Alphabet, and Amazon, performed well while most others struggled. Mid (S&P 400: -3.5%) and Small (Russell 2000: -3.3%) Caps, Value (Russell 1000 Value: -2.2%), Developed International (EAFE: -0.4%), and six out of eleven sectors were negative in the quarter.
» Narrow performance in the quarter is a great example of why we construct diversified portfolios across regions, countries, market caps, factors, styles, sectors, and industries and tilt toward the areas we feel provide the most potential benefit. Our view is that diversified portfolios can lead to more consistent and less volatile results than a single asset class. In our managed portfolios, we have exposure to the Mega Cap stocks that have done incredibly well, but we also have holdings in the asset classes that have recently lagged so we are prepared when the market shifts. Under-diversified investors likely feel like a genius or fool right now depending on how much they own in the top performers. Once the market inevitably rotates, so will the mental health of the under-diversified investors. We prefer not to ride that roller coaster. There is no guarantee that a diversified portfolio will enhance overall returns or outperform a non-diversified portfolio. Diversification does not protect against market risk.
Fixed Income Markets
Interest Rates
During the quarter, yields increased across most of the Treasury yield curve after rising in April and then pulling back in May and June as several inflation indicators began to moderate. The 2-Year Treasury increased by 13 basis points (bps) and the 10-Year rose by 20bps. The increase in yields created a headwind for the fixed income markets as bond prices move inversely to interest rates and credit spreads.
Short-term Bonds
Short-term bonds have closer maturities and are consequently less interest rate sensitive than intermediate- or long-term fixed income securities. Pursuing stability and income from short-term bonds, including Treasuries, has been a successful strategy as yields remain elevated. Short-term Treasury yields, including, the 3-Month (5.4%), 6-Month (5.3%), and 12-Month (5.1%) are still at their highest levels since the early 2000s. Once the Fed starts cutting the federal funds rate, short-term Treasury yields should also decline. We don’t expect +5% short-term yields to be around forever, but we are opportunistically enjoying them while they last. If interested, please speak with your advisor about our Cash Alternatives Strategy, which is an investment strategy designed to invest excess cash in a conservative portfolio of short-term fixed income securities. Bonds are subject to market and interest rate risk if sold prior to maturity. Bond values will decline as interest rates rise and bonds are subject to availability and change in price. Investing involves risk including loss of principal. This strategy and its related holdings are not FDIC-insured.
Intermediate-Term Bonds
The Bloomberg US Aggregate Bond index (Agg), which acts as a proxy for the intermediate-term investment-grade bond market, gained +0.1% despite the increase in the 10-Year Treasury yield. Coupon (interest) payments for the Agg bond index are now estimated at about 3.3% annually. Performance was positive in the quarter as coupon payments received were enough to offset the decline in price caused by higher interest rates. The year-to-date return of the Agg is now -0.7%.
We hold intermediate-term fixed income in diversified portfolios to pursue ballast and income. The last few years have been frustrating for intermediate-term fixed income investors as bonds produced negative returns in 2021 and 2022. We continue to recommend a patient approach, as all else equal, we expect intermediate-term bonds to provide both ballast and positive returns in the future if yields either stabilize or decline. We will highlight that the bond market’s performance since late last year is a great example of what happens when yields fall. From October 20th through the end of the quarter, the 10-Year yield fell by about -60 basis points while the Agg increased by +8.5%.
Intermediate-term bonds are still an attractive investment opportunity in our opinion as the yield to maturity on the US Aggregate Bond index ended the quarter at 5.0%. Yield to maturity is defined as the estimated annualized rate of return an investor can expect on a bond if purchased today and held to maturity, assuming the issuer makes all their interest and principal payments (i.e., no defaults). In our view, patient investors should be optimistic about intermediate-term fixed income returns over the next several years. Bonds are subject to market and interest rate risk if sold prior to maturity. Bond values will decline as interest rates rise and bonds are subject to availability and change in price.
The increase in inflation since early-2021 was driven by supply chain bottlenecks, surging energy prices, strong consumer demand caused by a solid labor market, and massive amounts of stimulus. Most inflation readings have decelerated from peak levels with several indicators returning to normalized ranges. Given that, the Fed is likely getting ready to declare victory over inflation by lowering interest rates at some point over the next few months.
The Fed has divided inflation into three buckets: goods (currently in outright deflationary territory as supply chains have normalized), housing (decelerating slowly under high mortgage rates and just starting to show up in the data), and non-housing related core services (moderating).
The Fed’s latest Summary of Economic Projections show the median participant expects Core PCE Inflation to fall to 2.8% in 2024, 2.3% in 2025, and 2.0% in 2026. Note that the Fed does not have inflation reaching their 2.0% target until 2026.
Here are several key inflation indicators and a chart tracking the data since the start of 2020:
» The Bureau of Labor Statistics Consumer Price Index (CPI) is a measure of the average change over time in the prices paid by urban consumers for a market basket of consumer goods and services. The index includes food and energy prices.
o Latest Reading: 3.3% (May). Peak: 9.1% (June 2022).
»The Core Personal Consumption Expenditure (PCE) Index measures the prices paid by consumers for goods and services based on surveys of what businesses are selling. Core means that the index excludes food and energy prices. This is the Fed’s preferred inflation measure, which they target at an average of 2%.
o Latest Reading: 2.6% (May). Peak: 5.6% (February 2022).
» The Core Producer Price Index (PPI)measures the average change in the selling prices received by domestic producers for their output. The prices included in the PPI are from the first commercial transaction for many products and some services.
o Latest Reading: 2.3% (May). Peak: 9.7% (March 2022).
» The Bureau of Labor Statistics Average Hourly Earnings tracks total hourly renumeration (in cash or in kind) paid to employees in return for work done (or paid leave). Data is from the Current Employment Statistics (CES) survey.
o Latest Reading: 4.1% (May). Peak: 8.1% (April 2020).
» The University of Michigan Inflation Expectations data is based on a monthly survey designed to gauge consumer expectations. Participants are asked for their view on annual inflation over the next 5 to 10 years.
o Latest Reading: 3.0% (June). Peak: 3.1% (January 2022).
The Federal Reserve serves as the central bank of the United States and performs critical functions designed to promote the health of the economy and stability of the financial system. The three key entities include the Board of Governors, twelve Federal Reserve Banks, and the Federal Open Market Committee (FOMC). The FOMC sets monetary policy in accordance with its mandate from Congress: to promote maximum employment and stable prices. According to the Fed, “monetary policy directly affects interest rates; it indirectly affects stock prices, wealth, and currency exchange rates. Through these channels, monetary policy influences spending, investment, production, employment, and inflation in the United States.” Please see our Client Question on The Fed.
Interest Rates: The top end of the federal funds rate has remained at 5.50% since July 2023. The FOMC has been on pause since raising rates by 5.25% total over a seventeen-month period beginning in March 2022. As the Fed gains more confidence that inflation is on a sustainable downward trajectory, they will begin to lower interest rates. The FOMC’s most recent Summary of Economic Projections (SEP) showed that the median participant expects they will lower rates to 5.1% in 2024 and to 4.1% in 2025.
Balance Sheet – Quantitative Tightening: The Fed also announced that starting in June their Quantitative Tightening program will slow down as the monthly cap on Treasury redemptions will shrink from $60 billion to $25 billion. The Fed’s balance sheet now stands at about $7.2 trillion, down from a peak of nearly $9 trillion in 2022. The Fed still thinks they can reduce the balance sheet close to its pre-pandemic size, but the decision to slow the runoff will inject more liquidity into the financial system compared to recent months. This should be supportive for keeping long-term interest rates lower in the near term.
The Fed has kept interest rates unchanged for the past eleven months while they try to balance their dual mandate of maximum employment and stable prices. According to Bloomberg, market pricing for expected rate cuts in 2024 reached 150 basis points earlier this year before declining to about 50 basis points currently as economic and inflation data have broadly exceeded expectations, especially earlier in the year. Investors who are upset that the Fed hasn’t cut rates yet should be careful what they wish for. Markets have rallied over the last several months as corporate earnings and economic growth have done remarkably well. If the Fed starts lowering interest rates substantially, it will likely be because the labor market and economy have hit a wall – this is not a good recipe for financial markets.
For investors, the important point is that the Fed has stopped aggressively raising interest rates and they would like to start cutting once inflation decelerates a bit further. This development has created a supportive environment for the economy and financial markets which should continue so long as inflation remains on a downward trajectory.
The US Economy continues to grow at a solid pace, supported by a strong labor market and consumer spending. We have seen a slowdown in recent data, but it is too early to say that cracks are forming. Real GDP growth is estimated at +2.3% in 2024 and +1.8% in 2025. While the unemployment rate hit 4.0% in May for the first time since January 2022, the measure is still far below the 50-year average of 6.2%. Additionally, most people have benefited from rising asset values and home prices. According to the Federal Reserve, total net worth for households and nonprofit organizations in the US increased to a record $160.8 trillion at the end of the first quarter.
Consumers are still spending money, and they should for as long as the labor market remains steady. The latest Retail Sales number came in at +2.3% Y/Y. There are some signs that the consumer is becoming stretched, including rising debt levels and diminished savings. Consumer health data is critical as consumption drives about 70% of GDP.
For the last several quarters, we thought that the key to economic growth was for inflation to become contained so the Fed can stop their tightening cycle before higher interest rates eventually lead to cracks in the labor market and/or the broader economy. The Fed appears ready to cut within the next few months, which should provide some relief through lower interest rates on credit card, mortgage, auto, and other types of loans.
The economy is in good shape for now. At some point things will slow down and there will be a recession. However, if a recession occurs in 2024 it will likely be due to some kind of external shock or unforeseen event.
Short-Term Outlook: Our short-term outlook has been cautious since the market began to run toward all-time highs late last year. For the stock market to maintain its positive momentum, we will need economic, inflation, and earnings data to continue exceeding already high expectations. Thus far, economic data has been fine. Inflation started the year hotter than expected but has recently begun to moderate. Earnings have been strong, especially from AI related companies. Right now, we see the biggest risks to the market as a reacceleration in inflation or anything the challenges the earnings growth of the AI leaders, especially Nvidia. Moving forward, we know that market declines are common, and we believe that a pause or pullback to shake out some of the excesses built up over the past several months would be healthy for long-term performance. Over short periods, we often turn cautious when the market gets greedy and extended, and positive when the market declines and investors begin to panic. No strategy assures success or protects against loss.
With the stock market at an all-time high, we believe this may be an opportune time to raise funds for upcoming cash flow needs and/or to take a fresh look at your target asset allocation based on your future goals and objectives. Although we generally keep two to three years of scheduled cash flows invested in short-term fixed income securities, we suggest implementing a plan for any aspirational purchases and bucket list items. Furthermore, while we proactively evaluate financial plans and asset allocation targets as part of ourTotal Net Worth Approach process, now is a great time to review both.
Long-term Investment Philosophy: In our view, investors with a globally diversified portfolio and a long-term time horizon should remain optimistic. Markets have historically increased over time despite frequent drawdowns as successful corporations have been able to figure out ways to generate profits through advances in innovation and productivity. To capitalize on the power of compounding, we believe in the benefits of staying Disciplined, Opportunistic, and Diversified, while striving to Mitigate fees, taxes, and expenses.
» Disciplined: consistently applying our investment process and philosophy, which are grounded in a long-term approach.
» Opportunistic: rebalancing, repositioning, and tax-loss harvesting to take advantage of market volatility and dislocations.
» Diversified: seeking to ensure that portfolios are properly allocated across and among asset classes to enhance consistency.
» Mitigate: striving to avoid unnecessary disbursements, including fees, taxes, and expenses.
In our opinion, adhering to a structured process and executing on all these components should help keep our clients on track toward pursuing their long-term objectives. Historically, equity markets have recovered from recessions and downturns. Past performance is no guarantee of future returns. There is no guarantee that a diversified portfolio will enhance overall returns or outperform a non-diversified portfolio. Diversification does not protect against market risk.
Content in this material is for general information only and not intended to provide specific advice or recommendations for any individual.
The economic forecasts set forth in this material may not develop as predicted and there can be no guarantee that strategies pro- moted will be successful.
All indexes mentioned are unmanaged indexes which cannot be invested into directly. Unmanaged index returns do not reflect fees, expenses, or sales charges. Index performance is not indicative of the performance of any investment. Past performance is no guarantee of future results.
The Standard & Poor’s 500 Index is a capitalization weighted index of 500 stocks designed to measure performance of the broad domestic economy through changes in the aggregate market value of 500 stocks representing all major industries.
The S&P Midcap 400 Stock Index is an unmanaged index generally representative of the market for the stocks of mid-sized US companies.
The Russell 2000 Index is an unmanaged index generally representative of the 2,000 smallest companies in the Russell 3000 index, which represents approximately 10% of the total market capitalization of the Russell 3000 Index.
The Russell 1000 Growth Index measures the performance of those Russell 1000 companies with higher price-to-book ratios and higher forecasted growth values. Russell 1000 Value Index measures the performance of those Russell 1000 companies with lower price-to-book ratios and lower forecasted growth values.
The Russell 3000 Growth Index is an unmanaged index comprised of those Russell 3000 companies with higher price-to-book ratios and higher forecasted growth values. The Russell 3000 Value Index measures the performance of those Russell 3000 companies with lower price-to-book ratios and lower forecasted growth values.
The prices of small cap stocks and mid cap stocks are generally more volatile than large cap stocks. The MSCI EAFE Index is a free float-adjusted market capitalization index that is designed to measure the equity market performance of developed markets, excluding the US & Canada.
The MSCI EAFE Index consists of the following developed country indices: Australia, Austria, Belgium, Denmark, Finland, France, Germany, Hong Kong, Ireland, Israel, Italy, Japan, the Netherlands, New Zealand, Norway, Portugal, Singapore, Spain, Sweden, Switzerland and the UK.
The MSCI EM (Emerging Markets) Index is a free float-adjusted market capitalization weighted index that is designed to measure the equity market performance of the emerging market countries of the Americas, Europe, the Middle East, Africa and Asia. The MSCI EM Index consists of the following emerging market country indices: Brazil, Chile, Colombia, Mexico, Peru, Czech Republic, Egypt, Greece, Hungary, Poland, Qatar, Russia, South Africa. Turkey, United Arab Emirates, China, India, Indonesia, Korea, Malaysia, Philippines, Taiwan, and Thailand.
The MSCI US Broad Market Index captures broad US equity coverage. The index includes 3,204 constituents across large, mid, small and micro capitalizations, representing about 99% of the US equity universe.
International investing involves special risks such as currency fluctuation and political instability and may not be suitable for all investors. These risks are often heightened for investments in emerging markets.
The Barclays Capital US Corporate High Yield Bond index is an index representative of the universe of fixed-rate, non-investment grade debt.
The Bloomberg Barclays US Aggregate Bond Index is a broad-based flagship benchmark that measures the investment grade, US dollar-denominated, fixed-rate taxable bond market.
The Bloomberg Barclays US Treasury Bills 1-3 Month Index is designed to measure the performance of public obligations of the U.S. Treasury that have a remaining maturity of greater than or equal to 1 month and less than 3 months. The Index includes all publicly issued zero coupon U.S. Treasury Bills that have a remaining maturity of less than 3 months and at least 1 month, are rated investment grade, and have $300 million or more of outstanding face value.
Bonds are subject to market and interest rate risk if sold prior to maturity. Bond values will decline as interest rates rise and bonds are subject to availability and change in price.
Government bonds and Treasury bills are guaranteed by the US government as to the timely payment of principal and interest and, if held to maturity, offer a fixed rate of return and fixed principal value.
Municipal bonds are subject to availability and change in price. They are subject to market and interest rate risk if sold prior to maturity. Bond values will decline as interest rates rise. Interest income may be subject to the alternative minimum tax. Municipal bonds are federally tax-free but other state and local taxes may apply. If sold prior to maturity, capital gains tax could apply.
High yield/junk bonds (grade BB or below) are not investment grade securities, and are subject to higher interest rate, credit, and liquidity risks than those graded BBB and above. They generally should be part of a diversified portfolio for sophisticated investors.
The market value of corporate bonds will fluctuate, and if the bond is sold prior to maturity, the investor’s yield may differ from the advertised yield.
Asset allocation does not ensure a profit or protect against loss. There is no guarantee that a diversified portfolio will enhance overall returns or outperform a non-diversified portfolio.
Diversification does not protect against market risk. All investing involves risk which you should be prepared to bear.
Securities offered through LPL Financial, Member FINRA/SIPC. Investment Advice offered through Winthrop Wealth, a Registered Investment Advisor and separate entity from LPL Financial.
United States Economic Data – Definitions
Leading Economic Indicators
The Conference Board US Leading Economic Indicators Index (LEI) is designed to forecast future activity based on economic variables that tend to move before changes in the overall economy. The index contains 10 data points. Updated monthly. Data goes back to 1960.
Financial Conditions Index
The Bloomberg US Financial Conditions Index tracks the overall level of financial stress in the money market, bond, and equity markets to help assess the availability and cost of credit. A positive value indicates accommodative financial conditions, while a negative value indicates tighter financial conditions. The number is a Z-Score that indicates the number of standard deviations by which current conditions deviate from normal levels. Updated daily. Data goes back to 1990.
ISM Manufacturing Index
The ISM Manufacturing PMI Index is based on a survey of more than 300 manufacturing firms – the index monitors employment, production, inventories, new orders, and supplier deliveries. A reading above 50 percent indicates that the manufacturing economy is generally expanding; below 50 percent indicates that it is generally contracting. Updated monthly. Data goes back to 1948.
ISM Services Index
The ISM Non-Manufacturing PMI Index is based on a survey of more than 300 non-manufacturing firms. The index is a composite of four indicators with equal weights: Business Activity, New Orders, Employment, and Supplier Deliveries. A reading above 50 percent indicates that the non-manufacturing economy is generally expanding; below 50 percent indicates that it is generally contracting. Updated monthly. Data goes back to 1997.
Retail Sales
The US Census Bureau Retail Sales data tracks the resale of new and used goods to the general public for personal or household consumption. Data is adjusted for seasonal variation and holiday and trading-day differences and calculated from a survey of approximately 5,500 retail and food services firms. Updated monthly. Data goes back to 1992.
Michigan Consumer Sentiment
The University of Michigan collects data on consumer attitudes and expectations. The index is comprised of measures of attitudes toward personal finances, general business conditions, and market conditions or prices. Updated monthly. Data goes back to 1966.
Debt-to-Service Ratio
The Federal Reserve Household Debt Service and Financial Obligations. Also known as Household Debt Service Ratio (DSR). Calculated as Household debt service payments and financial obligations as a percentage of disposable personal income; seasonally adjusted. Updated quarterly. Data goes back to 1979.
Unemployment Rate
The Bureau of Labor Statistics Unemployment Rate tracks the number of unemployment persons as a percentage of the labor force. The labor force is calculated as the total number of employed plus unemployed. The unemployment rate is calculated from the Current Population Survey (CPS). Updated monthly. Data goes back to 1948.
Change in Nonfarm Payrolls
The Bureau of Labor Statistics Nonfarm Payrolls measures the monthly change in the number of employees on business payrolls. Approximately 140k businesses and government agencies representing 690k individual worksites are surveyed each month. Data is from the Current Employment Statistics (CES) survey. Updated monthly. Data goes back to 1939.
JOLTS Job Openings
The Job Openings and Labor Turnover Survey (JOLTS) is conducted by the Bureau of Labor Statistics of the U.S. Department of Labor. The program involves the monthly collection, processing, and dissemination of job openings and labor turnover data. The data, collected from sampled establishments on a voluntary basis, include employment, job openings, hires, quits, layoffs and discharges, and other separations. Updated monthly. Data goes back to 2000.
Existing Home Sales
The National Association of Realtors Existing Home Sales SAAR tracks total existing home sales including single family homes, townhomes, condominiums, and co-ops. All sales are based on closings from Multiple Listing Services. Updated monthly. Data goes back to 1999.
Case-Shiller Home Price Index
The S&P Case-Shiller US National Home Price Index tracks the value of single-family housing within the United States. The index is a value-weighted average of 20 metro areas. Updated monthly. Data goes back to 2001.
30-Year Fixed Rate Mortgage
Bankrate.com calculates the national average 30-year Fixed Rate Mortgage. Updated daily. Data goes back to 1998.
Core PCE Inflation
The Core Personal Consumption Expenditure (PCE) index measures the prices paid by consumers for goods and services without the volatility caused by movements in food and energy prices to reveal underlying inflation trends. The FOMC targets an average of +2.0% Y/Y growth in Core PCE Inflation. Updated monthly. Data goes back to 1960.
Consumer Price Index
The Bureau of Labor Statistics Consumer Price Index (CPI) is a measure of the average change over time in the prices paid by urban consumers for a market basket of consumer goods and services. The index does include food and energy prices. Updated monthly. Data goes back to 1914.
Average Hourly Earnings
The Bureau of Labor Statistics Average Hourly Earnings tracks total hourly renumeration (in cash or in kind) paid to employees in return for work done (or paid leave). Data is from the Current Employment Statistics (CES) survey. Updated monthly. Data goes back to 2007.


< COMMENTARY
Market Commentary | July 02, 2024
Q2’2024 Market Review and Outlook
By Andrew Murphy, CFA
Co-Chief Investment Officer
Second Quarter 2024 Highlights
All data sourced from Bloomberg as of 6/30/24
» US Equity Markets: The equity market rally continued to roll in the second quarter as the S&P 500 increased by +4.3%. The market has gained in six of the last seven quarters. Year-to-date, the S&P is up by +15.3%. The market return was driven by moderation in several inflation indicators and spectacular earnings from several of the largest companies in the world. Market returns were broad based over the last several months, but that trend reversed starting in May with two of the largest stocks in the index, Apple (+23%) and Nvidia (+37%) doing most of the heavy lifting. Cumulatively, these two stocks accounted for nearly 75% of the S&P 500’s quarterly return with Nvidia responsible for about 44%.
» Treasury Yields: Yields increased across most of the Treasury yield curve after rising in April and then pulling back as several inflation indicators began to moderate. The 2-Year Treasury increased by 13 basis points (bps) and the 10-Year rose by 20bps.
» US Fixed Income Market: The Bloomberg US Aggregate Bond index (Agg), which acts as a proxy for the intermediate-term investment-grade bond market, gained +0.1% despite the increase in the 10-Year Treasury yield. The year-to-date return of the Agg is now -0.7%. Intermediate-term bonds are still an attractive investment opportunity in our opinion as the yield to maturity on the Agg index ended the quarter at 5.0%.
» Inflation: Most inflation readings have decelerated from peak levels with several indicators returning to normalized ranges. Given that, the Fed is likely getting ready to declare victory over inflation by lowering interest rates at some point over the next few months.
» The Fed: The top end of the federal funds rate has remained at 5.50% since July 2023. The FOMC has been on pause since raising rates by 5.25% total over a seventeen-month period beginning in March 2022. As the Fed gains more confidence that inflation is on a sustainable downward trajectory, they will begin to lower interest rates. The FOMC’s most recent Summary of Economic Projections (SEP) showed that the median participant expects they will lower rates to 5.1% in 2024 and to 4.1% in 2025.
» US Economy: The US Economy continues to grow at a solid pace, supported by a strong labor market and consumer spending. We have seen a slowdown in recent data, but it is too early to say that cracks are forming. Real GDP growth is estimated at +2.3% in 2024 and +1.8% in 2025.
» Short-Term Market Outlook: Our short-term outlook has been cautious since the market began to run toward all-time highs late last year. For the stock market to maintain its positive momentum, we will need economic, inflation, and earnings data to continue exceeding already high expectations. Thus far, economic data has been fine. Inflation started the year hotter than expected but has recently begun to moderate. Earnings have been strong, especially from AI related companies. Right now, we see the biggest risks to the market as a reacceleration in inflation or anything the challenges the earnings growth of the AI leaders, especially Nvidia. Moving forward, we know that market declines are common, and we believe that a pause or pullback to shake out some of the excesses built up over the past several months would be healthy for long-term performance. No strategy assures success or protects against loss.
» Long-term Investment Philosophy: Although our short-term outlook changes based on current conditions, our long-term outlook remains optimistic for investors with both a comprehensive financial plan and investment process. Markets have historically increased over time despite frequent drawdowns as successful corporations have been able to figure out ways to generate profits through advances in innovation and productivity. To capitalize on the power of compounding, we believe in the benefits of staying Disciplined, Opportunistic, and Diversified, while striving to Mitigate fees, taxes, and expenses. In our opinion, adhering to a structured process and executing on all these components should help keep our clients on track toward pursuing their long-term objectives. Historically, equity markets have recovered from recessions and downturns. Past performance is no guarantee of future returns. There is no guarantee that a diversified portfolio will enhance overall returns or outperform a non-diversified portfolio. Diversification does not protect against market risk.
US Equity Markets
The equity market rally continued to roll in the second quarter as the S&P 500 increased by +4.3%. The market has gained in six of the last seven quarters. Year-to-date, the S&P is up by +15.3%. The market return was driven by moderation in several inflation indicators and spectacular earnings from several of the largest companies in the world.
Performance over the last several years reinforces our belief in a long-term viewpoint as markets can be incredibly volatile over the short term. Please see our Client Question: Principles for Long-Term Investing.
Source: Bloomberg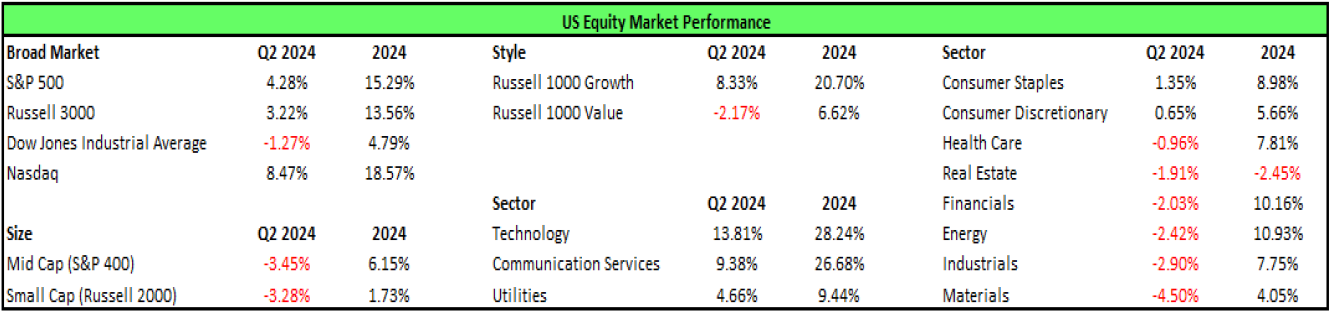
Key Points
» New All-Time High: The S&P 500 reached a new all-time closing high of 5,487 on June 18th.
» Bull Market Alive and Well: The market is up by nearly +57% since the start of the latest bull market on 10/12/22. The market rally over that time was driven by evidence of disinflation, the economy, labor market, and corporate earnings all exceeding expectations, the Fed thinking about cutting rates, and the impact of artificial intelligence (AI) will have on profits and productivity.
» Nvidia Goes Parabolic: Nvidia, the global leader in graphics processing units (GPUs) for use in artificial intelligence (AI) applications, has had a spectacular run as the stock has gained over +975% since mid-October 2022. During the quarter, Nvidia briefly became the largest publicly traded company in the world and ended the period with a market cap above $3 trillion. The stock gained +37% in the second quarter and has now increased by about +150% year-to-date.
» Leadership Narrows: Market returns were broad based over the last several months, but that trend reversed starting in May with two of the largest stocks in the index, Apple (+23%) and Nvidia (+37%) doing most of the heavy lifting. Cumulatively, these two stocks accounted for nearly 75% of the S&P 500’s quarterly return with Nvidia responsible for about 44%.
» Mega Caps or Nothing (For Now): Asset classes (Large Cap, Growth, Technology, and Communication Services) that contain the Mega Cap Growth stocks like Apple, Nvidia, Microsoft, Alphabet, and Amazon, performed well while most others struggled. Mid (S&P 400: -3.5%) and Small (Russell 2000: -3.3%) Caps, Value (Russell 1000 Value: -2.2%), Developed International (EAFE: -0.4%), and six out of eleven sectors were negative in the quarter.
» Narrow performance in the quarter is a great example of why we construct diversified portfolios across regions, countries, market caps, factors, styles, sectors, and industries and tilt toward the areas we feel provide the most potential benefit. Our view is that diversified portfolios can lead to more consistent and less volatile results than a single asset class. In our managed portfolios, we have exposure to the Mega Cap stocks that have done incredibly well, but we also have holdings in the asset classes that have recently lagged so we are prepared when the market shifts. Under-diversified investors likely feel like a genius or fool right now depending on how much they own in the top performers. Once the market inevitably rotates, so will the mental health of the under-diversified investors. We prefer not to ride that roller coaster. There is no guarantee that a diversified portfolio will enhance overall returns or outperform a non-diversified portfolio. Diversification does not protect against market risk.
Fixed Income Markets
Interest Rates
During the quarter, yields increased across most of the Treasury yield curve after rising in April and then pulling back in May and June as several inflation indicators began to moderate. The 2-Year Treasury increased by 13 basis points (bps) and the 10-Year rose by 20bps. The increase in yields created a headwind for the fixed income markets as bond prices move inversely to interest rates and credit spreads.
Short-term Bonds
Short-term bonds have closer maturities and are consequently less interest rate sensitive than intermediate- or long-term fixed income securities. Pursuing stability and income from short-term bonds, including Treasuries, has been a successful strategy as yields remain elevated. Short-term Treasury yields, including, the 3-Month (5.4%), 6-Month (5.3%), and 12-Month (5.1%) are still at their highest levels since the early 2000s. Once the Fed starts cutting the federal funds rate, short-term Treasury yields should also decline. We don’t expect +5% short-term yields to be around forever, but we are opportunistically enjoying them while they last. If interested, please speak with your advisor about our Cash Alternatives Strategy, which is an investment strategy designed to invest excess cash in a conservative portfolio of short-term fixed income securities. Bonds are subject to market and interest rate risk if sold prior to maturity. Bond values will decline as interest rates rise and bonds are subject to availability and change in price. Investing involves risk including loss of principal. This strategy and its related holdings are not FDIC-insured.
Intermediate-Term Bonds
The Bloomberg US Aggregate Bond index (Agg), which acts as a proxy for the intermediate-term investment-grade bond market, gained +0.1% despite the increase in the 10-Year Treasury yield. Coupon (interest) payments for the Agg bond index are now estimated at about 3.3% annually. Performance was positive in the quarter as coupon payments received were enough to offset the decline in price caused by higher interest rates. The year-to-date return of the Agg is now -0.7%.
We hold intermediate-term fixed income in diversified portfolios to pursue ballast and income. The last few years have been frustrating for intermediate-term fixed income investors as bonds produced negative returns in 2021 and 2022. We continue to recommend a patient approach, as all else equal, we expect intermediate-term bonds to provide both ballast and positive returns in the future if yields either stabilize or decline. We will highlight that the bond market’s performance since late last year is a great example of what happens when yields fall. From October 20th through the end of the quarter, the 10-Year yield fell by about -60 basis points while the Agg increased by +8.5%.
Intermediate-term bonds are still an attractive investment opportunity in our opinion as the yield to maturity on the US Aggregate Bond index ended the quarter at 5.0%. Yield to maturity is defined as the estimated annualized rate of return an investor can expect on a bond if purchased today and held to maturity, assuming the issuer makes all their interest and principal payments (i.e., no defaults). In our view, patient investors should be optimistic about intermediate-term fixed income returns over the next several years. Bonds are subject to market and interest rate risk if sold prior to maturity. Bond values will decline as interest rates rise and bonds are subject to availability and change in price.
Inflation
The increase in inflation since early-2021 was driven by supply chain bottlenecks, surging energy prices, strong consumer demand caused by a solid labor market, and massive amounts of stimulus. Most inflation readings have decelerated from peak levels with several indicators returning to normalized ranges. Given that, the Fed is likely getting ready to declare victory over inflation by lowering interest rates at some point over the next few months.
The Fed has divided inflation into three buckets: goods (currently in outright deflationary territory as supply chains have normalized), housing (decelerating slowly under high mortgage rates and just starting to show up in the data), and non-housing related core services (moderating).
The Fed’s latest Summary of Economic Projections show the median participant expects Core PCE Inflation to fall to 2.8% in 2024, 2.3% in 2025, and 2.0% in 2026. Note that the Fed does not have inflation reaching their 2.0% target until 2026.
Here are several key inflation indicators and a chart tracking the data since the start of 2020:
» The Bureau of Labor Statistics Consumer Price Index (CPI) is a measure of the average change over time in the prices paid by urban consumers for a market basket of consumer goods and services. The index includes food and energy prices.
o Latest Reading: 3.3% (May). Peak: 9.1% (June 2022).
» The Core Personal Consumption Expenditure (PCE) Index measures the prices paid by consumers for goods and services based on surveys of what businesses are selling. Core means that the index excludes food and energy prices. This is the Fed’s preferred inflation measure, which they target at an average of 2%.
o Latest Reading: 2.6% (May). Peak: 5.6% (February 2022).
» The Core Producer Price Index (PPI) measures the average change in the selling prices received by domestic producers for their output. The prices included in the PPI are from the first commercial transaction for many products and some services.
o Latest Reading: 2.3% (May). Peak: 9.7% (March 2022).
» The Bureau of Labor Statistics Average Hourly Earnings tracks total hourly renumeration (in cash or in kind) paid to employees in return for work done (or paid leave). Data is from the Current Employment Statistics (CES) survey.
o Latest Reading: 4.1% (May). Peak: 8.1% (April 2020).
» The University of Michigan Inflation Expectations data is based on a monthly survey designed to gauge consumer expectations. Participants are asked for their view on annual inflation over the next 5 to 10 years.
o Latest Reading: 3.0% (June). Peak: 3.1% (January 2022).
The Fed
The Federal Reserve serves as the central bank of the United States and performs critical functions designed to promote the health of the economy and stability of the financial system. The three key entities include the Board of Governors, twelve Federal Reserve Banks, and the Federal Open Market Committee (FOMC). The FOMC sets monetary policy in accordance with its mandate from Congress: to promote maximum employment and stable prices. According to the Fed, “monetary policy directly affects interest rates; it indirectly affects stock prices, wealth, and currency exchange rates. Through these channels, monetary policy influences spending, investment, production, employment, and inflation in the United States.” Please see our Client Question on The Fed.
Interest Rates: The top end of the federal funds rate has remained at 5.50% since July 2023. The FOMC has been on pause since raising rates by 5.25% total over a seventeen-month period beginning in March 2022. As the Fed gains more confidence that inflation is on a sustainable downward trajectory, they will begin to lower interest rates. The FOMC’s most recent Summary of Economic Projections (SEP) showed that the median participant expects they will lower rates to 5.1% in 2024 and to 4.1% in 2025.
Balance Sheet – Quantitative Tightening: The Fed also announced that starting in June their Quantitative Tightening program will slow down as the monthly cap on Treasury redemptions will shrink from $60 billion to $25 billion. The Fed’s balance sheet now stands at about $7.2 trillion, down from a peak of nearly $9 trillion in 2022. The Fed still thinks they can reduce the balance sheet close to its pre-pandemic size, but the decision to slow the runoff will inject more liquidity into the financial system compared to recent months. This should be supportive for keeping long-term interest rates lower in the near term.
The Fed has kept interest rates unchanged for the past eleven months while they try to balance their dual mandate of maximum employment and stable prices. According to Bloomberg, market pricing for expected rate cuts in 2024 reached 150 basis points earlier this year before declining to about 50 basis points currently as economic and inflation data have broadly exceeded expectations, especially earlier in the year. Investors who are upset that the Fed hasn’t cut rates yet should be careful what they wish for. Markets have rallied over the last several months as corporate earnings and economic growth have done remarkably well. If the Fed starts lowering interest rates substantially, it will likely be because the labor market and economy have hit a wall – this is not a good recipe for financial markets.
For investors, the important point is that the Fed has stopped aggressively raising interest rates and they would like to start cutting once inflation decelerates a bit further. This development has created a supportive environment for the economy and financial markets which should continue so long as inflation remains on a downward trajectory.
US Economy
The US Economy continues to grow at a solid pace, supported by a strong labor market and consumer spending. We have seen a slowdown in recent data, but it is too early to say that cracks are forming. Real GDP growth is estimated at +2.3% in 2024 and +1.8% in 2025. While the unemployment rate hit 4.0% in May for the first time since January 2022, the measure is still far below the 50-year average of 6.2%. Additionally, most people have benefited from rising asset values and home prices. According to the Federal Reserve, total net worth for households and nonprofit organizations in the US increased to a record $160.8 trillion at the end of the first quarter.
Consumers are still spending money, and they should for as long as the labor market remains steady. The latest Retail Sales number came in at +2.3% Y/Y. There are some signs that the consumer is becoming stretched, including rising debt levels and diminished savings. Consumer health data is critical as consumption drives about 70% of GDP.
For the last several quarters, we thought that the key to economic growth was for inflation to become contained so the Fed can stop their tightening cycle before higher interest rates eventually lead to cracks in the labor market and/or the broader economy. The Fed appears ready to cut within the next few months, which should provide some relief through lower interest rates on credit card, mortgage, auto, and other types of loans.
The economy is in good shape for now. At some point things will slow down and there will be a recession. However, if a recession occurs in 2024 it will likely be due to some kind of external shock or unforeseen event.
Outlook
Short-Term Outlook: Our short-term outlook has been cautious since the market began to run toward all-time highs late last year. For the stock market to maintain its positive momentum, we will need economic, inflation, and earnings data to continue exceeding already high expectations. Thus far, economic data has been fine. Inflation started the year hotter than expected but has recently begun to moderate. Earnings have been strong, especially from AI related companies. Right now, we see the biggest risks to the market as a reacceleration in inflation or anything the challenges the earnings growth of the AI leaders, especially Nvidia. Moving forward, we know that market declines are common, and we believe that a pause or pullback to shake out some of the excesses built up over the past several months would be healthy for long-term performance. Over short periods, we often turn cautious when the market gets greedy and extended, and positive when the market declines and investors begin to panic. No strategy assures success or protects against loss.
With the stock market at an all-time high, we believe this may be an opportune time to raise funds for upcoming cash flow needs and/or to take a fresh look at your target asset allocation based on your future goals and objectives. Although we generally keep two to three years of scheduled cash flows invested in short-term fixed income securities, we suggest implementing a plan for any aspirational purchases and bucket list items. Furthermore, while we proactively evaluate financial plans and asset allocation targets as part of our Total Net Worth Approach process, now is a great time to review both.
Long-term Investment Philosophy: In our view, investors with a globally diversified portfolio and a long-term time horizon should remain optimistic. Markets have historically increased over time despite frequent drawdowns as successful corporations have been able to figure out ways to generate profits through advances in innovation and productivity. To capitalize on the power of compounding, we believe in the benefits of staying Disciplined, Opportunistic, and Diversified, while striving to Mitigate fees, taxes, and expenses.
» Disciplined: consistently applying our investment process and philosophy, which are grounded in a long-term approach.
» Opportunistic: rebalancing, repositioning, and tax-loss harvesting to take advantage of market volatility and dislocations.
» Diversified: seeking to ensure that portfolios are properly allocated across and among asset classes to enhance consistency.
» Mitigate: striving to avoid unnecessary disbursements, including fees, taxes, and expenses.
In our opinion, adhering to a structured process and executing on all these components should help keep our clients on track toward pursuing their long-term objectives. Historically, equity markets have recovered from recessions and downturns. Past performance is no guarantee of future returns. There is no guarantee that a diversified portfolio will enhance overall returns or outperform a non-diversified portfolio. Diversification does not protect against market risk.
Second Quarter 2024 Market Returns
DISCLOSURES
Content in this material is for general information only and not intended to provide specific advice or recommendations for any individual.
The economic forecasts set forth in this material may not develop as predicted and there can be no guarantee that strategies pro- moted will be successful.
All indexes mentioned are unmanaged indexes which cannot be invested into directly. Unmanaged index returns do not reflect fees, expenses, or sales charges. Index performance is not indicative of the performance of any investment. Past performance is no guarantee of future results.
The Standard & Poor’s 500 Index is a capitalization weighted index of 500 stocks designed to measure performance of the broad domestic economy through changes in the aggregate market value of 500 stocks representing all major industries.
The S&P Midcap 400 Stock Index is an unmanaged index generally representative of the market for the stocks of mid-sized US companies.
The Russell 2000 Index is an unmanaged index generally representative of the 2,000 smallest companies in the Russell 3000 index, which represents approximately 10% of the total market capitalization of the Russell 3000 Index.
The Russell 1000 Growth Index measures the performance of those Russell 1000 companies with higher price-to-book ratios and higher forecasted growth values. Russell 1000 Value Index measures the performance of those Russell 1000 companies with lower price-to-book ratios and lower forecasted growth values.
The Russell 3000 Growth Index is an unmanaged index comprised of those Russell 3000 companies with higher price-to-book ratios and higher forecasted growth values. The Russell 3000 Value Index measures the performance of those Russell 3000 companies with lower price-to-book ratios and lower forecasted growth values.
The prices of small cap stocks and mid cap stocks are generally more volatile than large cap stocks. The MSCI EAFE Index is a free float-adjusted market capitalization index that is designed to measure the equity market performance of developed markets, excluding the US & Canada.
The MSCI EAFE Index consists of the following developed country indices: Australia, Austria, Belgium, Denmark, Finland, France, Germany, Hong Kong, Ireland, Israel, Italy, Japan, the Netherlands, New Zealand, Norway, Portugal, Singapore, Spain, Sweden, Switzerland and the UK.
The MSCI EM (Emerging Markets) Index is a free float-adjusted market capitalization weighted index that is designed to measure the equity market performance of the emerging market countries of the Americas, Europe, the Middle East, Africa and Asia. The MSCI EM Index consists of the following emerging market country indices: Brazil, Chile, Colombia, Mexico, Peru, Czech Republic, Egypt, Greece, Hungary, Poland, Qatar, Russia, South Africa. Turkey, United Arab Emirates, China, India, Indonesia, Korea, Malaysia, Philippines, Taiwan, and Thailand.
The MSCI US Broad Market Index captures broad US equity coverage. The index includes 3,204 constituents across large, mid, small and micro capitalizations, representing about 99% of the US equity universe.
International investing involves special risks such as currency fluctuation and political instability and may not be suitable for all investors. These risks are often heightened for investments in emerging markets.
The Barclays Capital US Corporate High Yield Bond index is an index representative of the universe of fixed-rate, non-investment grade debt.
The Bloomberg Barclays US Aggregate Bond Index is a broad-based flagship benchmark that measures the investment grade, US dollar-denominated, fixed-rate taxable bond market.
The Bloomberg Barclays US Treasury Bills 1-3 Month Index is designed to measure the performance of public obligations of the U.S. Treasury that have a remaining maturity of greater than or equal to 1 month and less than 3 months. The Index includes all publicly issued zero coupon U.S. Treasury Bills that have a remaining maturity of less than 3 months and at least 1 month, are rated investment grade, and have $300 million or more of outstanding face value.
Bonds are subject to market and interest rate risk if sold prior to maturity. Bond values will decline as interest rates rise and bonds are subject to availability and change in price.
Government bonds and Treasury bills are guaranteed by the US government as to the timely payment of principal and interest and, if held to maturity, offer a fixed rate of return and fixed principal value.
Municipal bonds are subject to availability and change in price. They are subject to market and interest rate risk if sold prior to maturity. Bond values will decline as interest rates rise. Interest income may be subject to the alternative minimum tax. Municipal bonds are federally tax-free but other state and local taxes may apply. If sold prior to maturity, capital gains tax could apply.
High yield/junk bonds (grade BB or below) are not investment grade securities, and are subject to higher interest rate, credit, and liquidity risks than those graded BBB and above. They generally should be part of a diversified portfolio for sophisticated investors.
The market value of corporate bonds will fluctuate, and if the bond is sold prior to maturity, the investor’s yield may differ from the advertised yield.
Asset allocation does not ensure a profit or protect against loss. There is no guarantee that a diversified portfolio will enhance overall returns or outperform a non-diversified portfolio.
Diversification does not protect against market risk. All investing involves risk which you should be prepared to bear.
Securities offered through LPL Financial, Member FINRA/SIPC. Investment Advice offered through Winthrop Wealth, a Registered Investment Advisor and separate entity from LPL Financial.
United States Economic Data – Definitions
Leading Economic Indicators
The Conference Board US Leading Economic Indicators Index (LEI) is designed to forecast future activity based on economic variables that tend to move before changes in the overall economy. The index contains 10 data points. Updated monthly. Data goes back to 1960.
Financial Conditions Index
The Bloomberg US Financial Conditions Index tracks the overall level of financial stress in the money market, bond, and equity markets to help assess the availability and cost of credit. A positive value indicates accommodative financial conditions, while a negative value indicates tighter financial conditions. The number is a Z-Score that indicates the number of standard deviations by which current conditions deviate from normal levels. Updated daily. Data goes back to 1990.
ISM Manufacturing Index
The ISM Manufacturing PMI Index is based on a survey of more than 300 manufacturing firms – the index monitors employment, production, inventories, new orders, and supplier deliveries. A reading above 50 percent indicates that the manufacturing economy is generally expanding; below 50 percent indicates that it is generally contracting. Updated monthly. Data goes back to 1948.
ISM Services Index
The ISM Non-Manufacturing PMI Index is based on a survey of more than 300 non-manufacturing firms. The index is a composite of four indicators with equal weights: Business Activity, New Orders, Employment, and Supplier Deliveries. A reading above 50 percent indicates that the non-manufacturing economy is generally expanding; below 50 percent indicates that it is generally contracting. Updated monthly. Data goes back to 1997.
Retail Sales
The US Census Bureau Retail Sales data tracks the resale of new and used goods to the general public for personal or household consumption. Data is adjusted for seasonal variation and holiday and trading-day differences and calculated from a survey of approximately 5,500 retail and food services firms. Updated monthly. Data goes back to 1992.
Michigan Consumer Sentiment
The University of Michigan collects data on consumer attitudes and expectations. The index is comprised of measures of attitudes toward personal finances, general business conditions, and market conditions or prices. Updated monthly. Data goes back to 1966.
Debt-to-Service Ratio
The Federal Reserve Household Debt Service and Financial Obligations. Also known as Household Debt Service Ratio (DSR). Calculated as Household debt service payments and financial obligations as a percentage of disposable personal income; seasonally adjusted. Updated quarterly. Data goes back to 1979.
Unemployment Rate
The Bureau of Labor Statistics Unemployment Rate tracks the number of unemployment persons as a percentage of the labor force. The labor force is calculated as the total number of employed plus unemployed. The unemployment rate is calculated from the Current Population Survey (CPS). Updated monthly. Data goes back to 1948.
Change in Nonfarm Payrolls
The Bureau of Labor Statistics Nonfarm Payrolls measures the monthly change in the number of employees on business payrolls. Approximately 140k businesses and government agencies representing 690k individual worksites are surveyed each month. Data is from the Current Employment Statistics (CES) survey. Updated monthly. Data goes back to 1939.
JOLTS Job Openings
The Job Openings and Labor Turnover Survey (JOLTS) is conducted by the Bureau of Labor Statistics of the U.S. Department of Labor. The program involves the monthly collection, processing, and dissemination of job openings and labor turnover data. The data, collected from sampled establishments on a voluntary basis, include employment, job openings, hires, quits, layoffs and discharges, and other separations. Updated monthly. Data goes back to 2000.
Existing Home Sales
The National Association of Realtors Existing Home Sales SAAR tracks total existing home sales including single family homes, townhomes, condominiums, and co-ops. All sales are based on closings from Multiple Listing Services. Updated monthly. Data goes back to 1999.
Case-Shiller Home Price Index
The S&P Case-Shiller US National Home Price Index tracks the value of single-family housing within the United States. The index is a value-weighted average of 20 metro areas. Updated monthly. Data goes back to 2001.
30-Year Fixed Rate Mortgage
Bankrate.com calculates the national average 30-year Fixed Rate Mortgage. Updated daily. Data goes back to 1998.
Core PCE Inflation
The Core Personal Consumption Expenditure (PCE) index measures the prices paid by consumers for goods and services without the volatility caused by movements in food and energy prices to reveal underlying inflation trends. The FOMC targets an average of +2.0% Y/Y growth in Core PCE Inflation. Updated monthly. Data goes back to 1960.
Consumer Price Index
The Bureau of Labor Statistics Consumer Price Index (CPI) is a measure of the average change over time in the prices paid by urban consumers for a market basket of consumer goods and services. The index does include food and energy prices. Updated monthly. Data goes back to 1914.
Average Hourly Earnings
The Bureau of Labor Statistics Average Hourly Earnings tracks total hourly renumeration (in cash or in kind) paid to employees in return for work done (or paid leave). Data is from the Current Employment Statistics (CES) survey. Updated monthly. Data goes back to 2007.